Analysis of the 2024 Local Elections
On February 27, 2024, elections were held in 242 localities throughout Israel. The following analysis reviews the results of the elections from a number of angles.
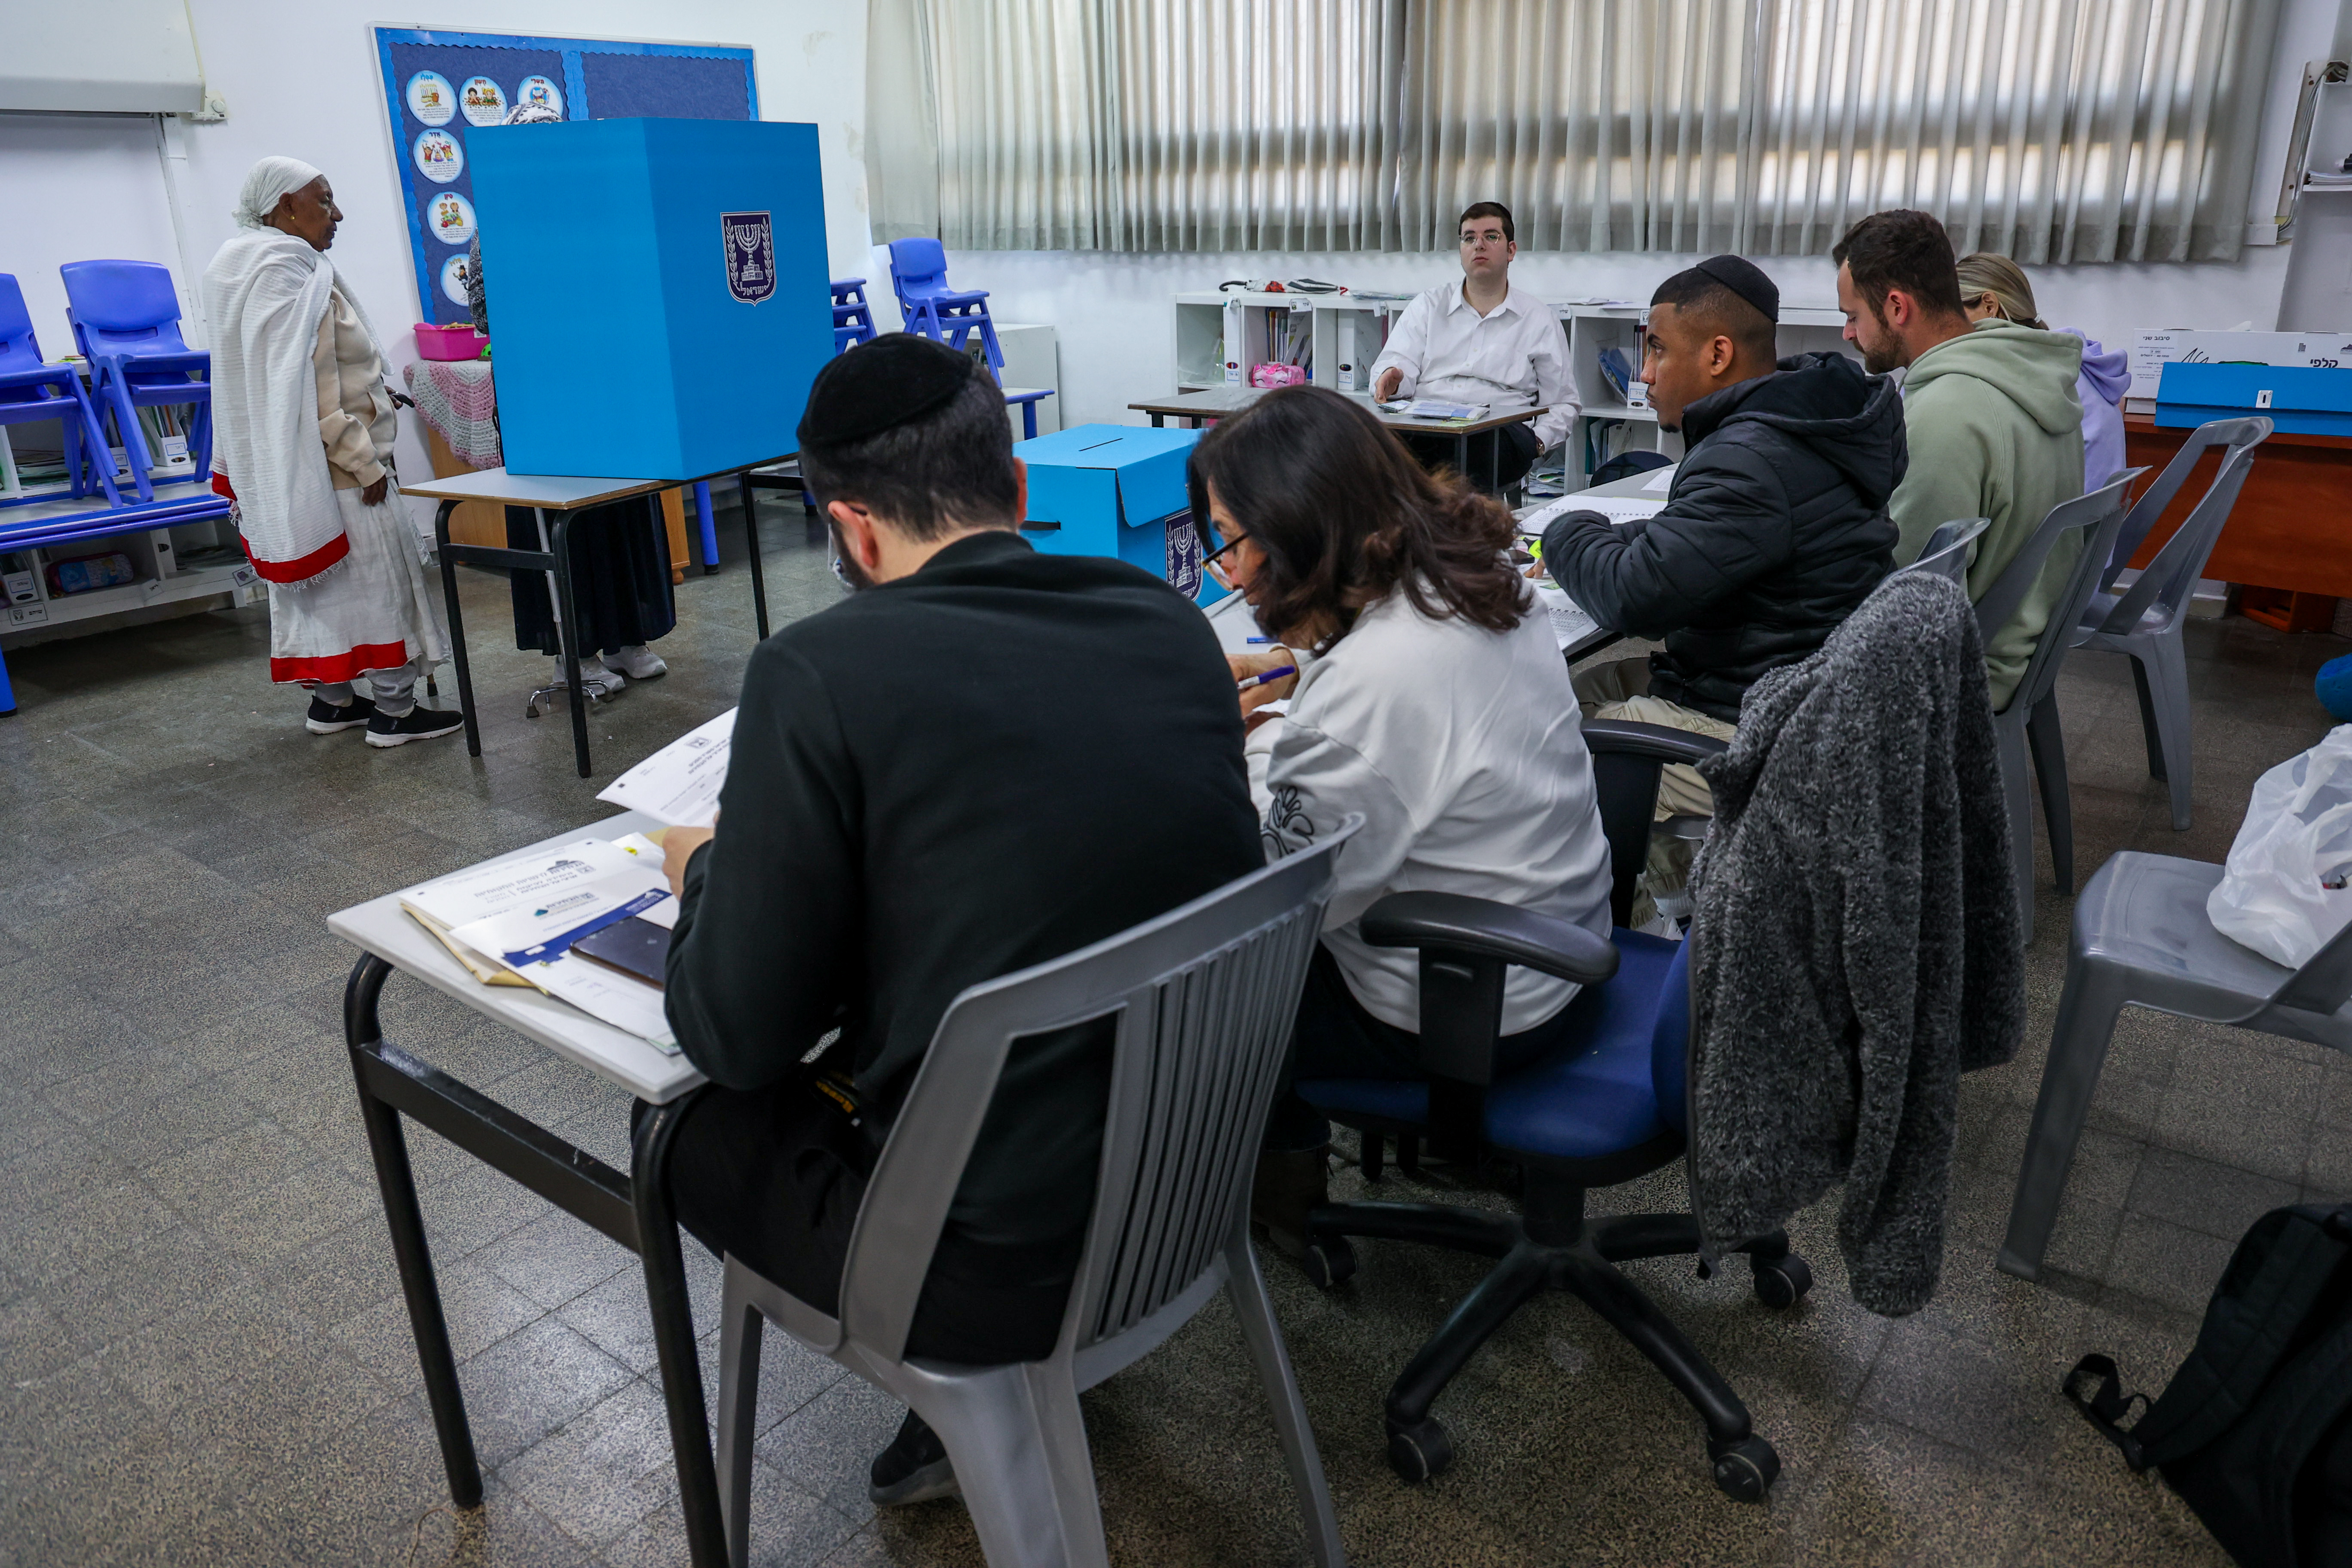
Elections in Beit Shemesh 2024. Photo by: Jonathan Shaul/Flash90
On February 27, 2024, elections were held in 242 localities throughout Israel; two weeks later, on March 10, there was a second round in 35 of them.[1] The elections were originally scheduled for late October 2023 but were postponed because of the war that broke out early that month. Elections would have been held in 253 localities on the original date; but in 11 of them in northern and southern Israel, whose residents had been evacuated because of the war, the elections were postponed and are now scheduled for November 2024. The following analysis reviews the results of the elections from a number of angles.
Figure 1 shows the overall turnout in local elections from 1978 through 2024.
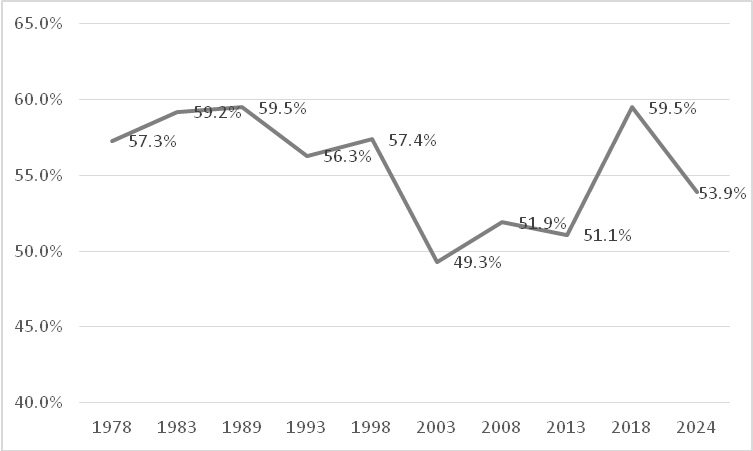
Figure 1. Voter Turnout in Local Elections, 1978–2024 (percent)
Turnout in 2024 was lower than it had been in 2018, but was nevertheless greater than in the elections of 2003, 2008, and 2013. It seems likely that the decline in 2024 was influenced by the war against Hamas, which reduced public attention to local elections. On the other hand, local Election Day was an official holiday in 2018 and 2024 (as had been the case until 1989). This may explain why turnout in 2024 was higher than in the three local elections before 2018, when Election Day was a normal working day.
Figures 2 and 3 break down turnout by population groups.
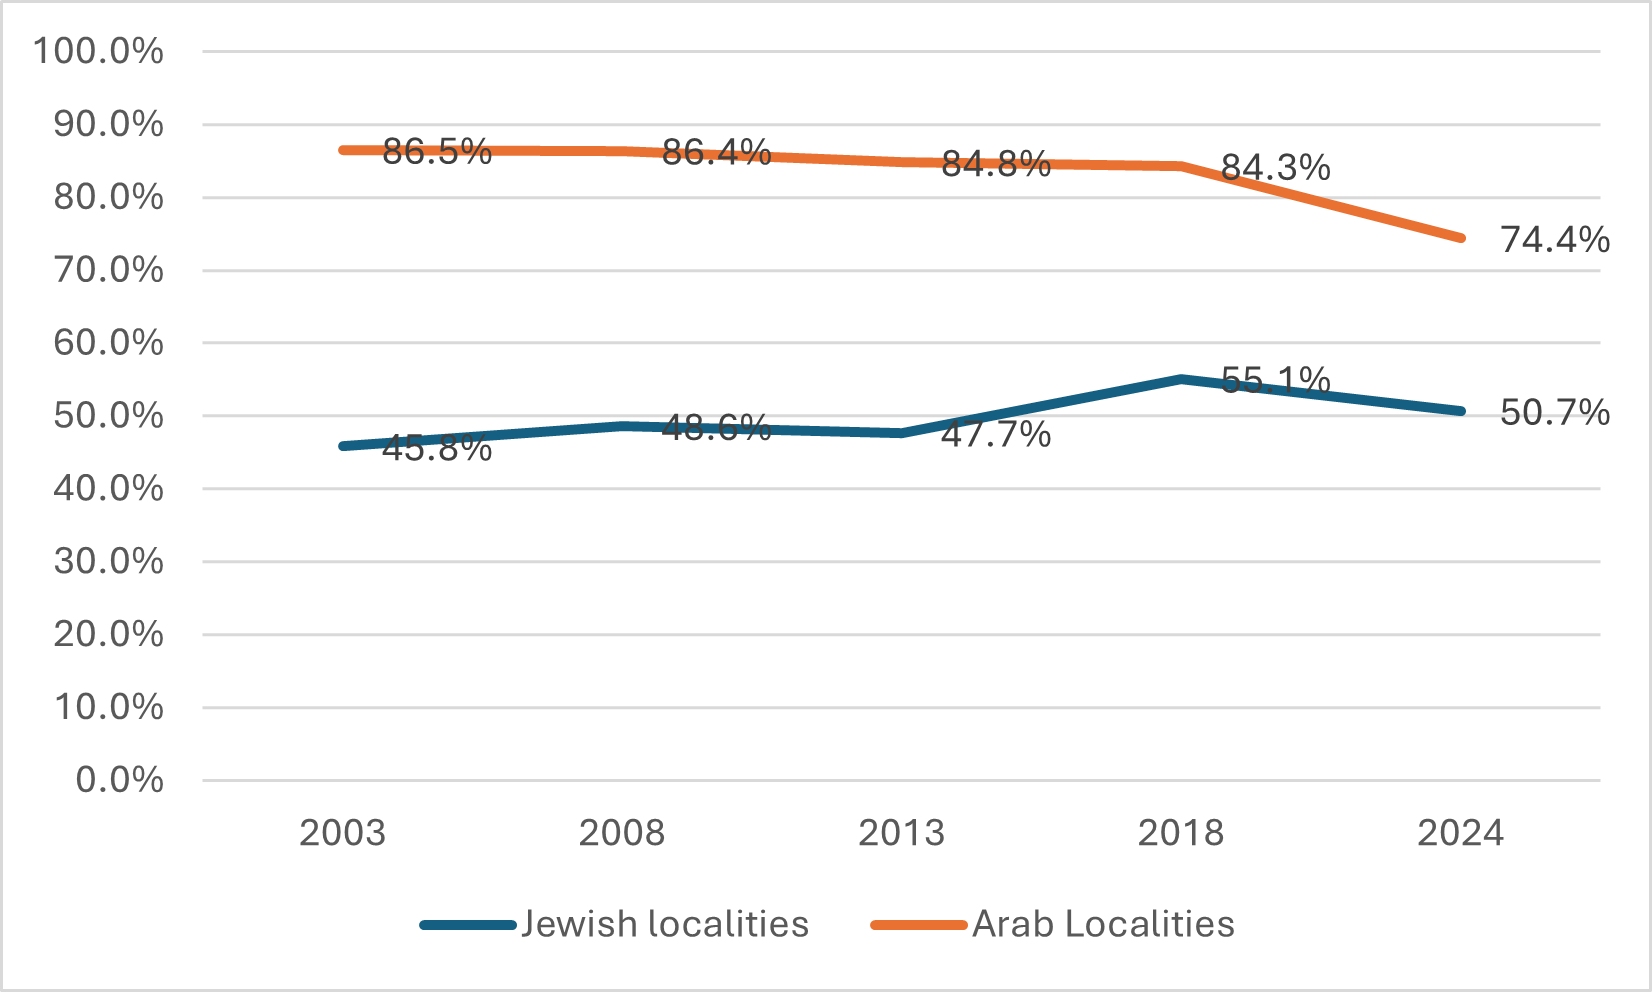
Figure 2. Voter Turnout in Local Elections, Jewish and Arab localities, 2003–2024 (percent)
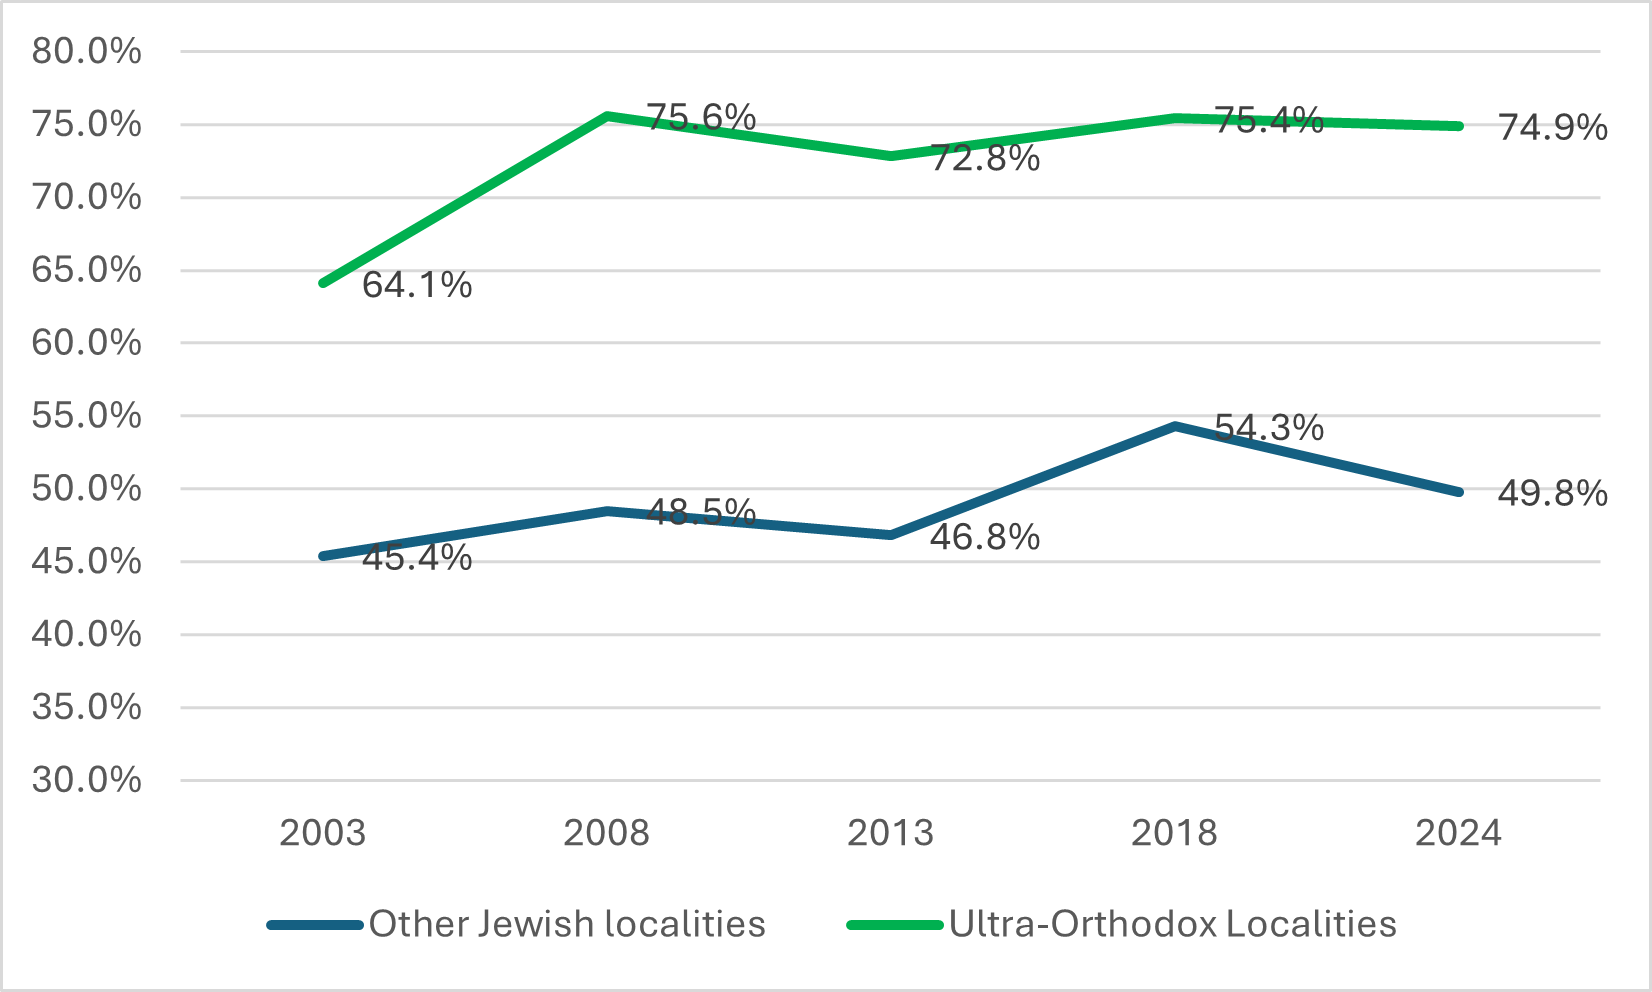
Figure 3. Voter Turnout in Local Elections, ultra-Orthodox and Other Jewish Localities, 2003–2024 (percent)
The change in turnout was not uniform for all sectors. In Arab localities the decline in turnout from 2018 was 10%; in non-ultra-Orthodox Jewish localities it was 4.5%; and in ultra-Orthodox localities it was only 0.5%.
Despite the decline, voter turnout in Arab localities was still relatively high and almost the same as in ultra-Orthodox localities. Regarding the latter, the stability in turnout may be explained by the fact that the ultra-Orthodox may have been less impacted by the war, given that so few of them serve in the military. Nevertheless, Arabs in Israel, too, are less involved and affected by the war (at least in terms of the number directly involved in fighting), and that is where the largest decline in turnout was observed. It may be, then, that turnout in ultra-Orthodox localities did not decline because these elections were particularly contentious and competitive, and this compensated for the negative effect of the war. On the other hand, as we will see below, in Arab localities there was less competition this year, although this fact itself requires explanation.
Figure 4 shows the percentage of women running for mayor and the number of women elected since 2003. The figure indicating the proportion of candidates includes only men and women who did not drop out before Election Day. Because no women ran for mayor in Arab localities, only Jewish localities are included in Figure 5.
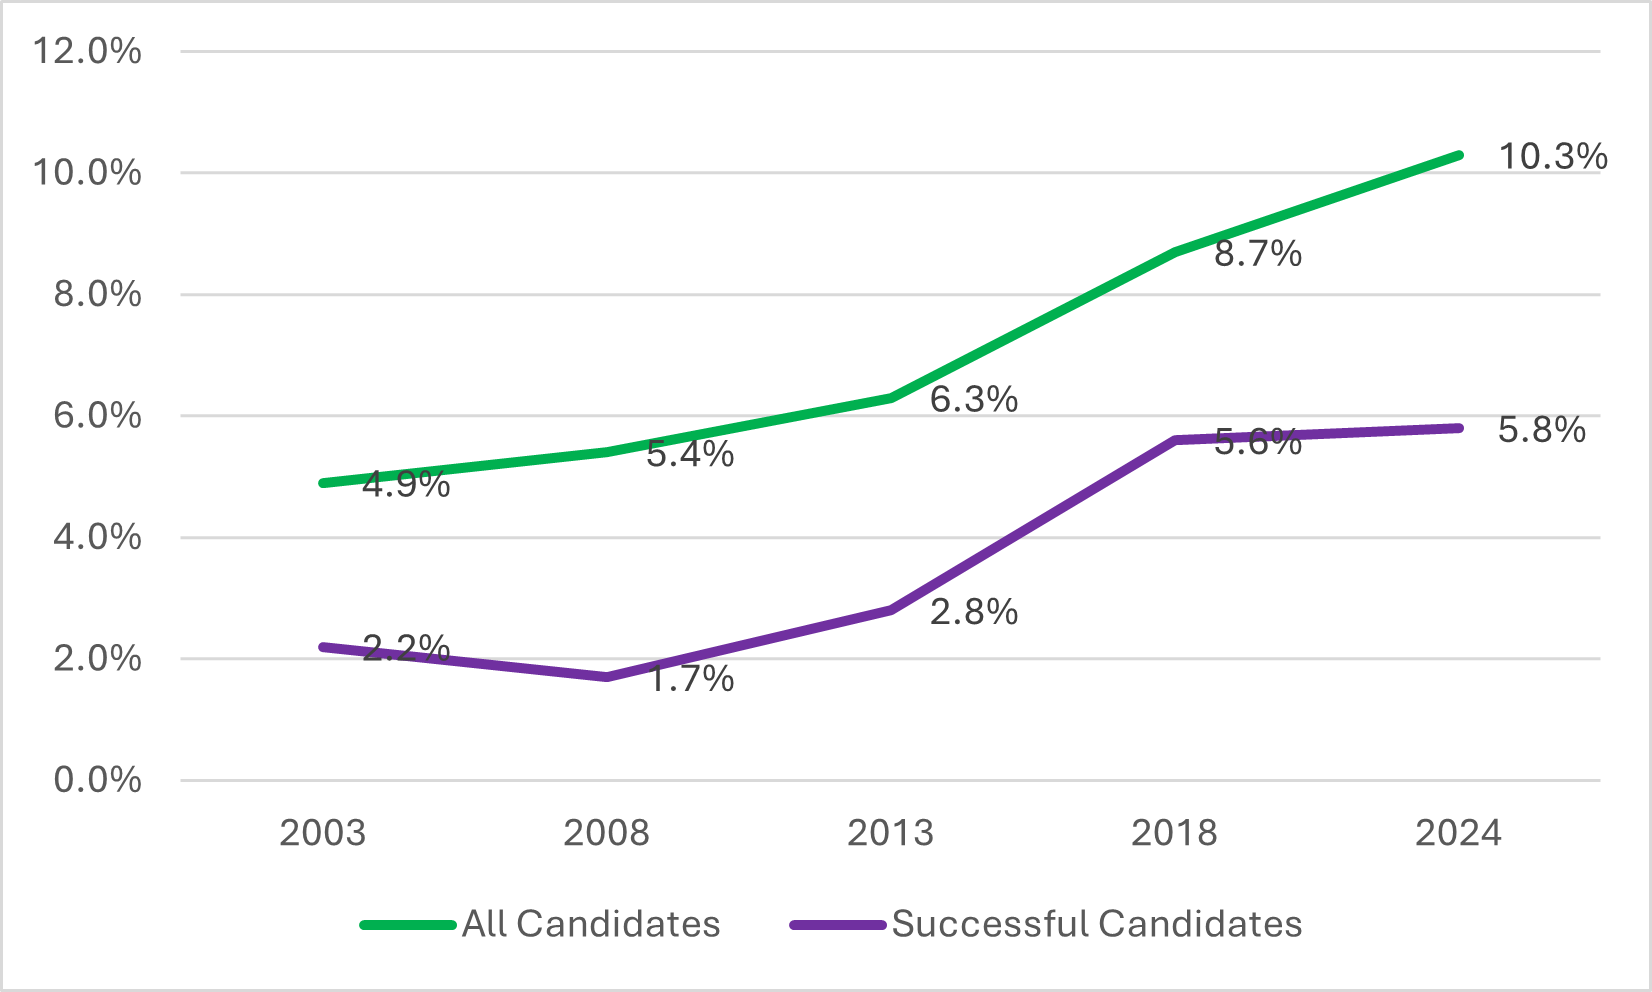
Figure 4. Percentage of Women Running for Mayor: Candidates and Victors, 2003–2024 (percent)
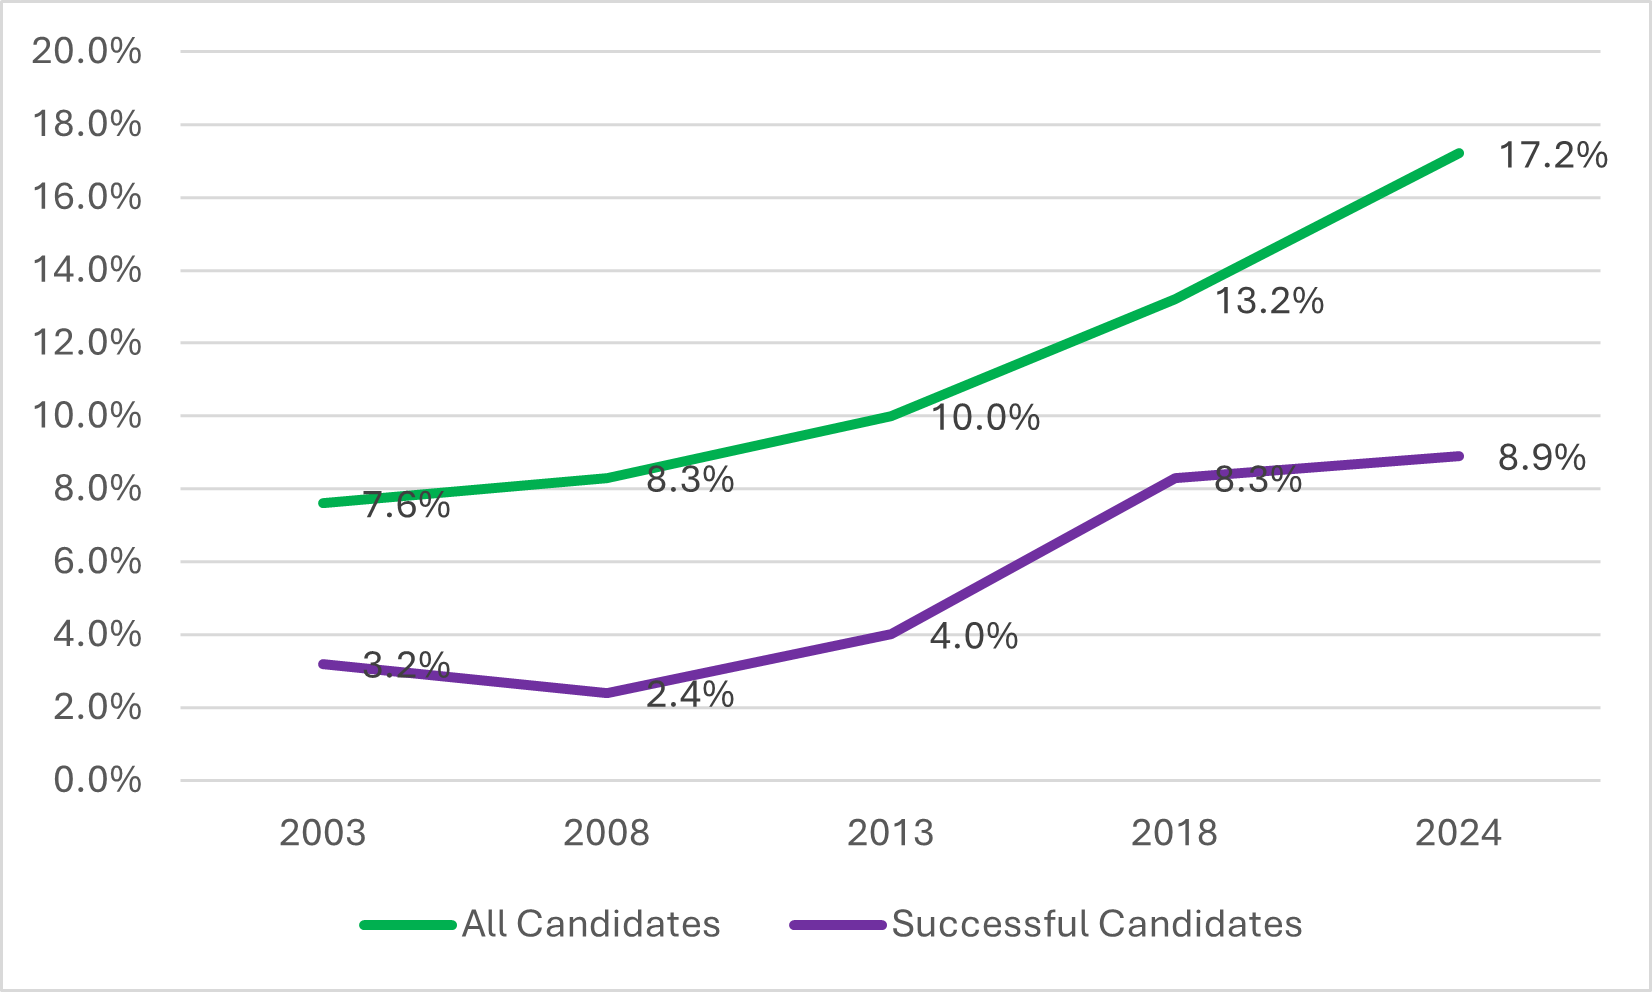
Figure 5. Percentage of Women Running for Mayor: Candidates and Victors, Jewish localities, 2003–2024 (percent)
As the graphs show, there was no dramatic change in the percentage of women who were elected mayor in 2024, although there was an increase in the percentage of female candidates for the office in Jewish localities, from 13.2% to 17.2%. In numbers, 75 women ran for mayor in 2024, out of the total of 728 candidates; 14 of them won their race in the 242 localities where elections were held.
Note that three women filed to run for mayor but dropped out before Election Day. In addition, in the 11 localities where elections have been postponed until November 24 because of the war, eight women are running for mayor (in six localities). Hence it is possible that after the elections in those places there will be a further increase in the number and percentage of female mayors.
By contrast, the percentage of women council members increased as result of the 2024 elections. Figure 6 shows the percentage of female council members over the years. Here information for regional councils is available only for the last two elections, so the figure until then refers to cities and local councils only.[2] Figure 7 compares Jewish and Arab localities.
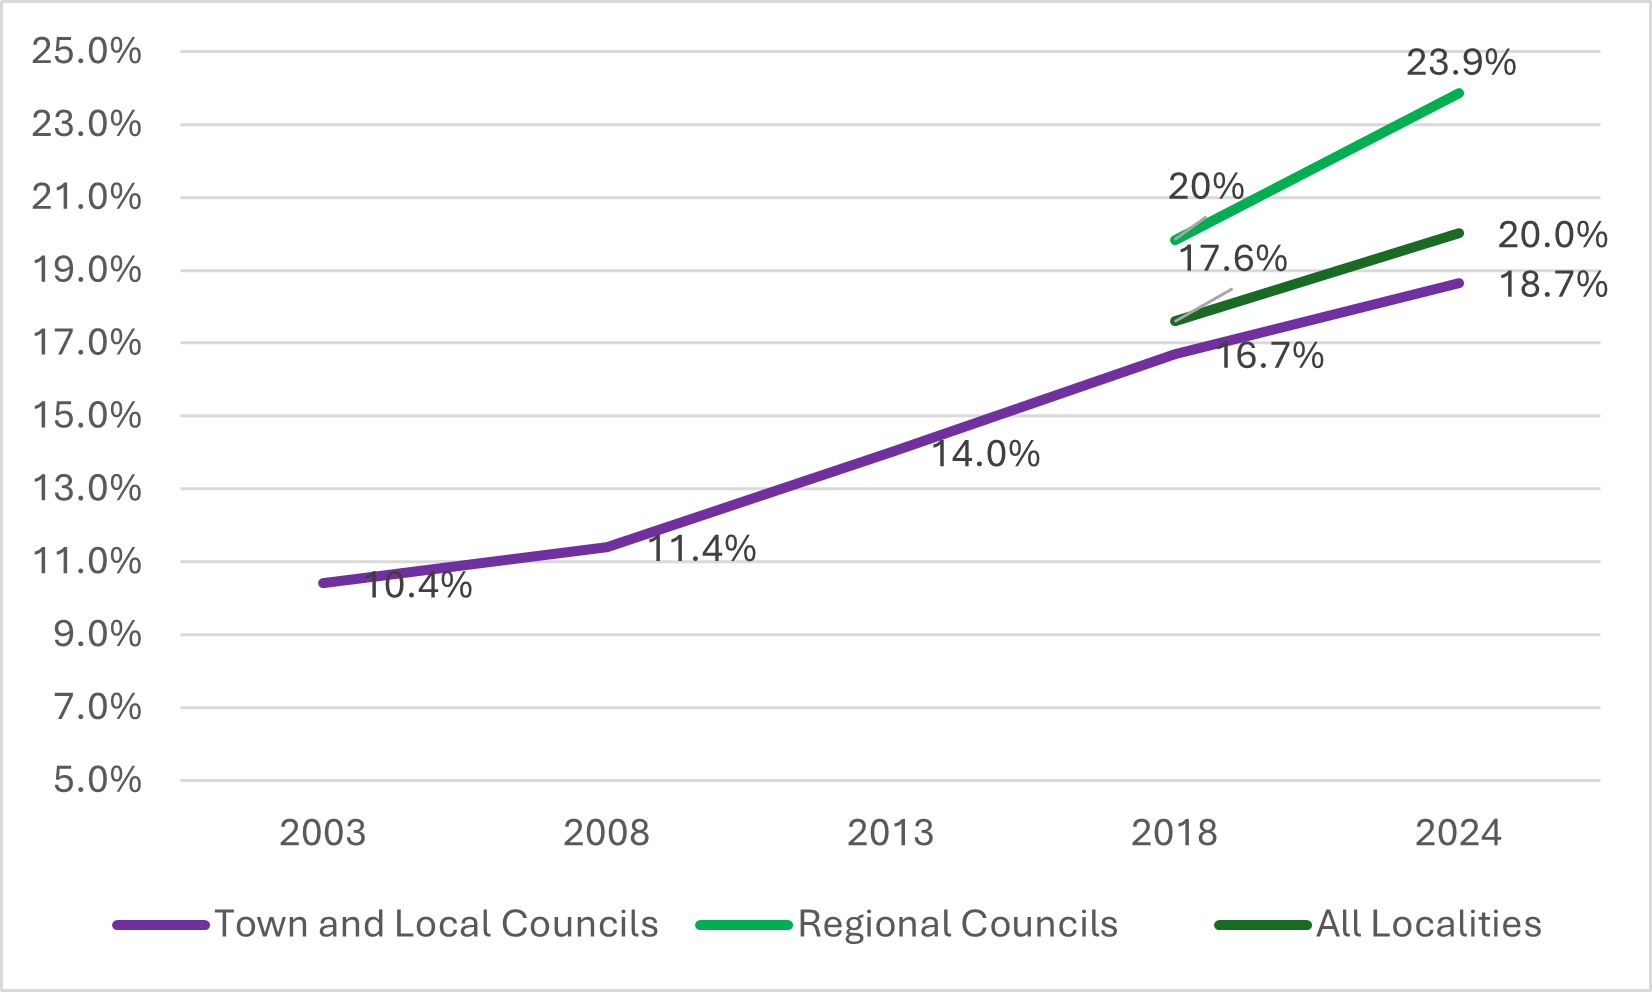
Figure 6. Percentage of Female Council Members in Israel, 2003–2024 (percent)
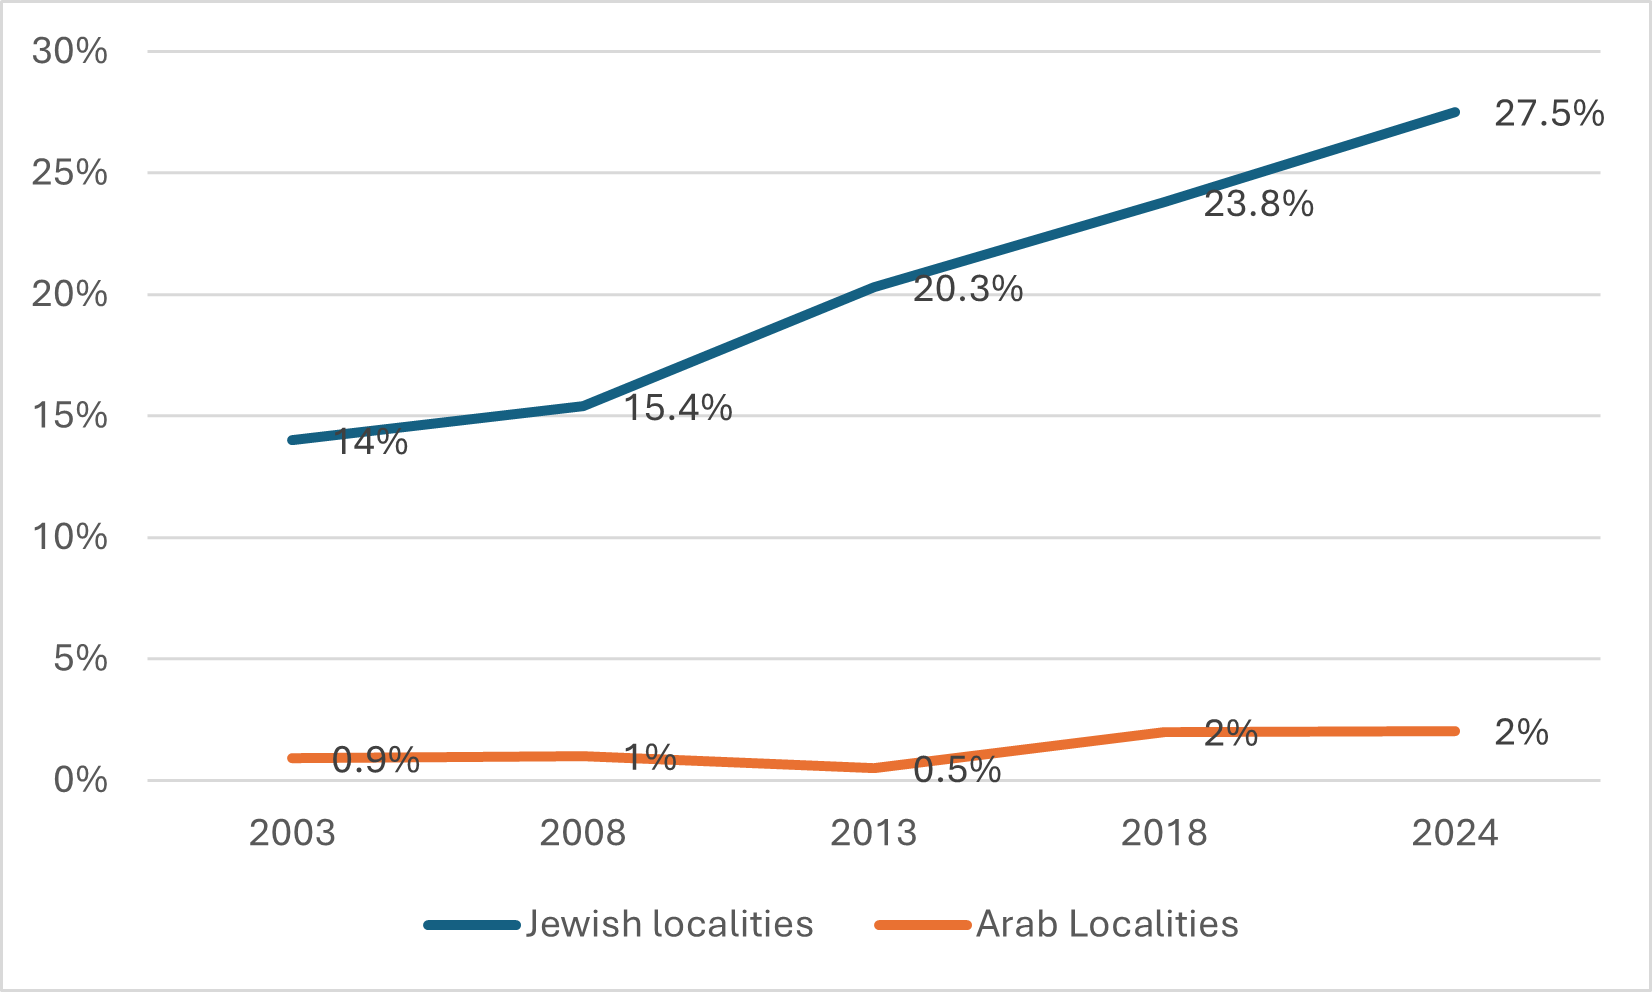
Figure 7. Percentage of Women on City and Local Councils, Jewish and Arab Localities, 2003–2024 (percent)
As shown in Figure 7, the percentage of female council members increased only in Jewish localities (23.8% to 27.5%), whereas there was been no change in Arab localities (2%). In numbers, 482 women were elected to local councils in 2024, out of 1755 council members; in Arab localities, of 930 council members, only 19 women were elected. An analysis at the level of individual localities reveals that after 2018 there were four localities with a female majority on their councils; after the 2024 elections, there were nine.
The basic measure of competition is, of course, the number of candidates running. In 2024, 805 persons filed to run for mayor in 242 localities, but 73 of them dropped out before election day and therefore do not appear in the final election results. Figure 8 displays the average number of candidates for mayor as compared to previous elections, broken down by Jewish and Arab localities.
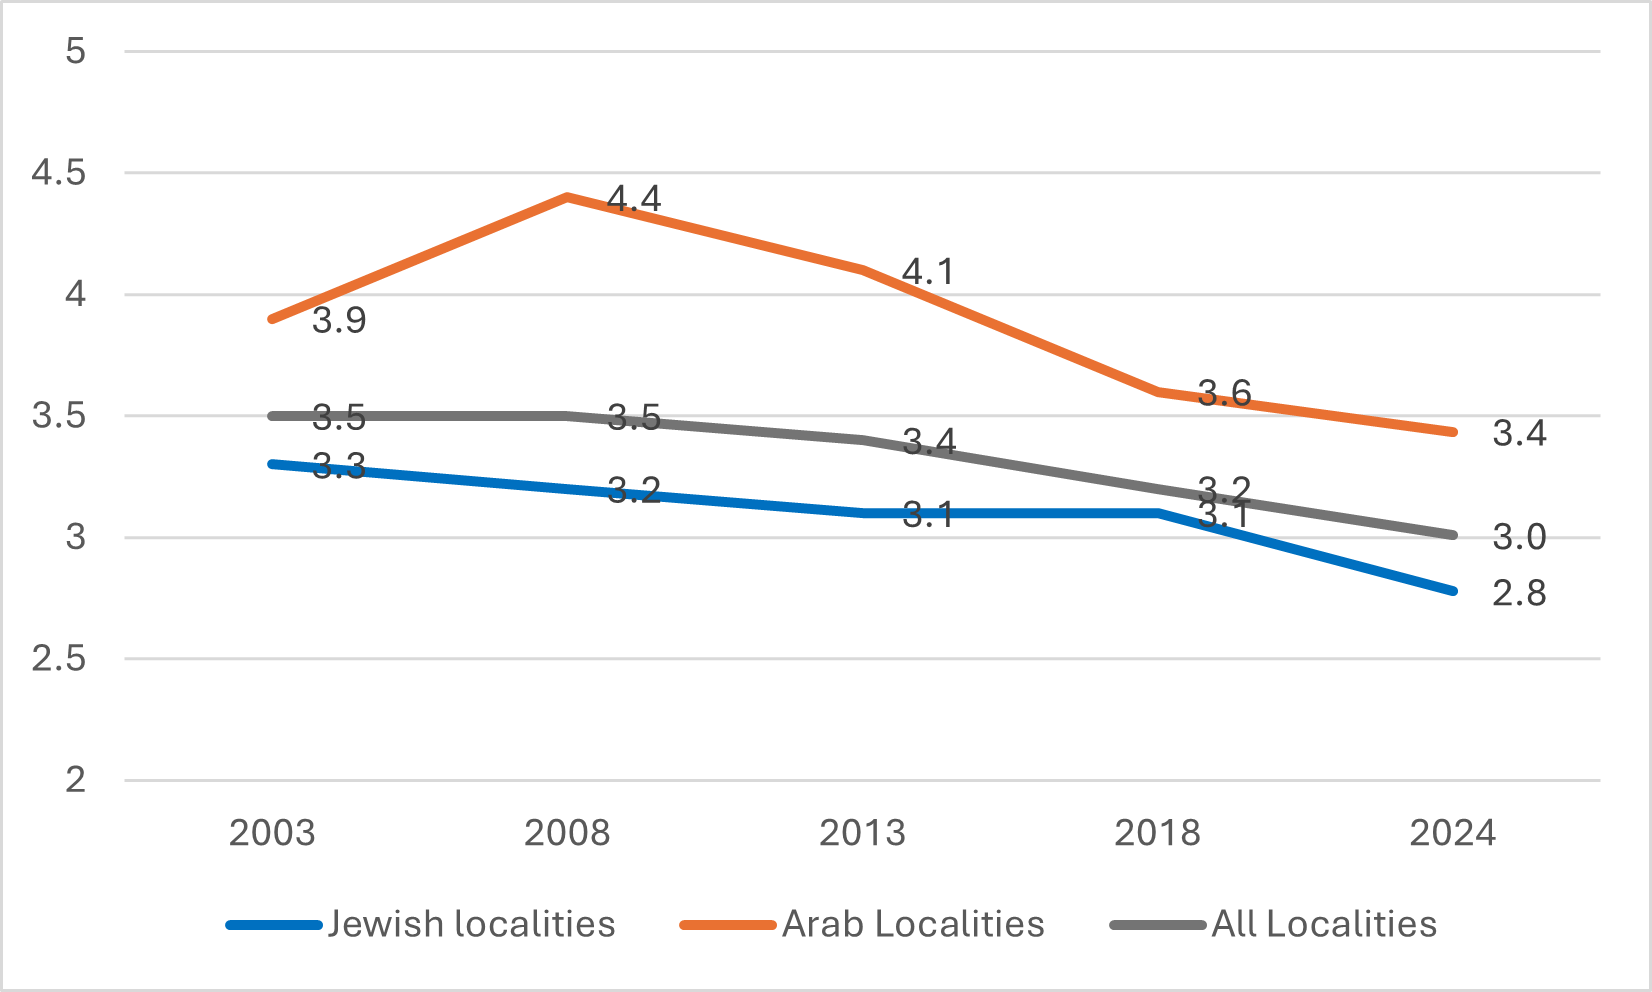
Figure 8. Average Number of Candidates for Mayor, 2003–2024 (absolute number)
Another metric of competitive elections is how close the results were. A second round is held if no candidate receives 40% of the vote; therefore, the percentage of localities where there is a second round is an indicator of competitiveness. The most extreme case of no competition is a locality where only a single candidate is running.[3] Figures 9 and 10 display the percentage of local authorities with a second round and of those where there was only a single candidate in 2024, with comparison to previous election years.
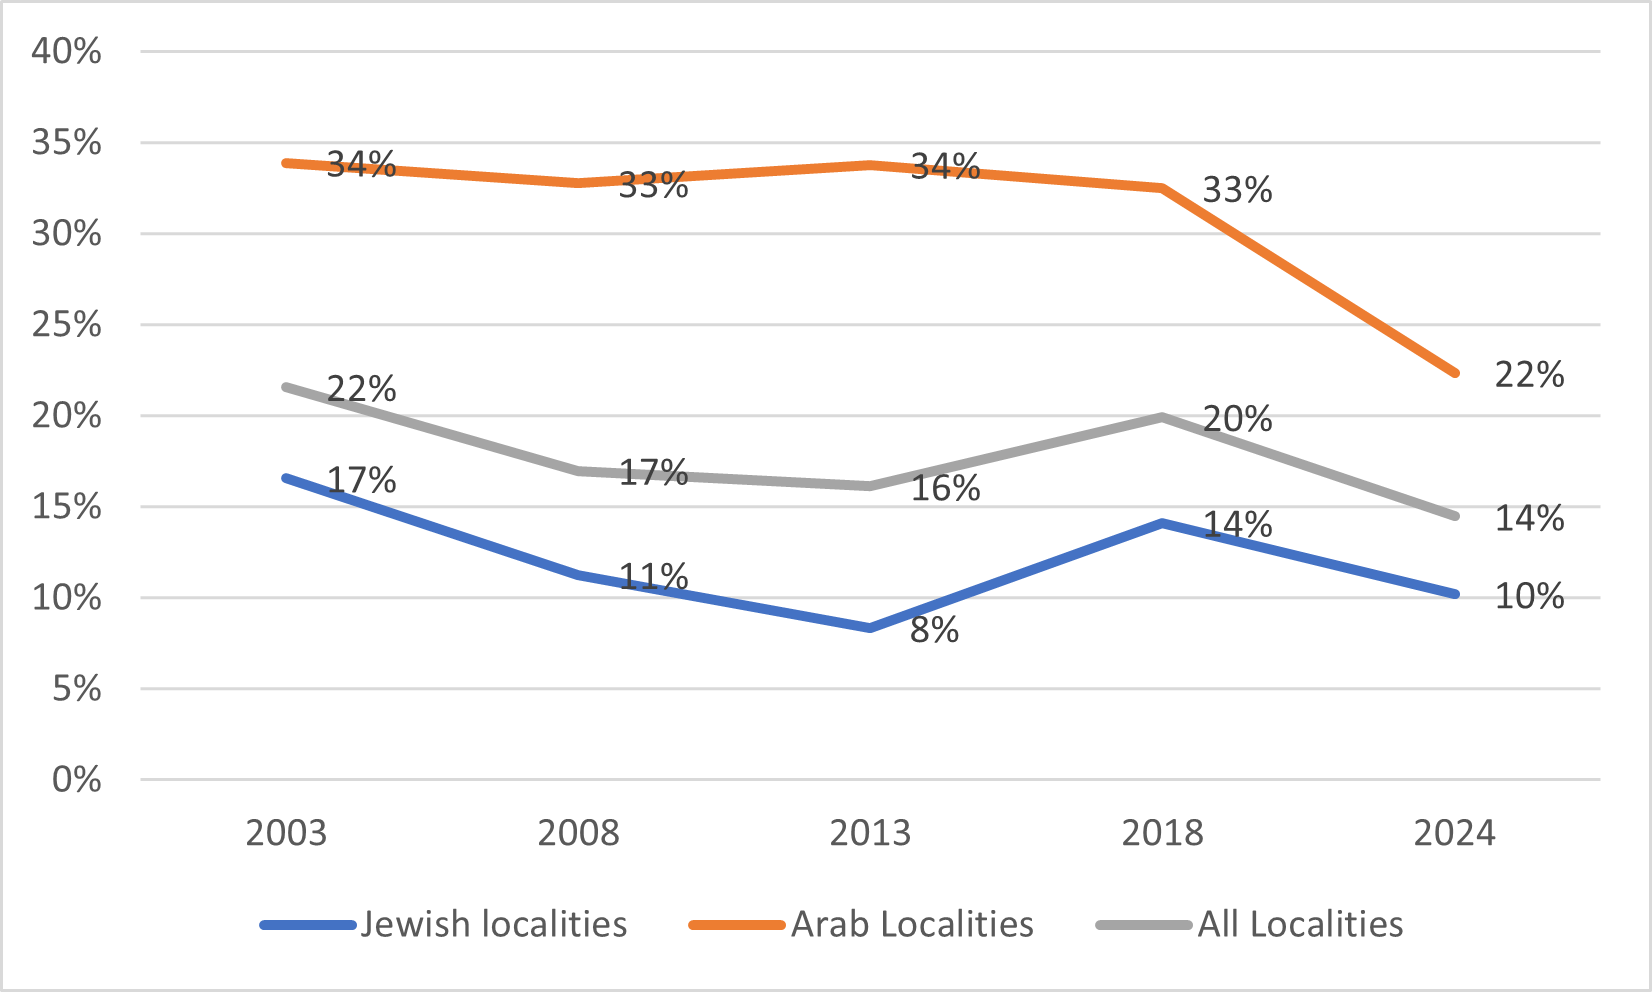
Figure 9. Percentage of Localities with a Second Round of Voting, 2003–2024 (percent)
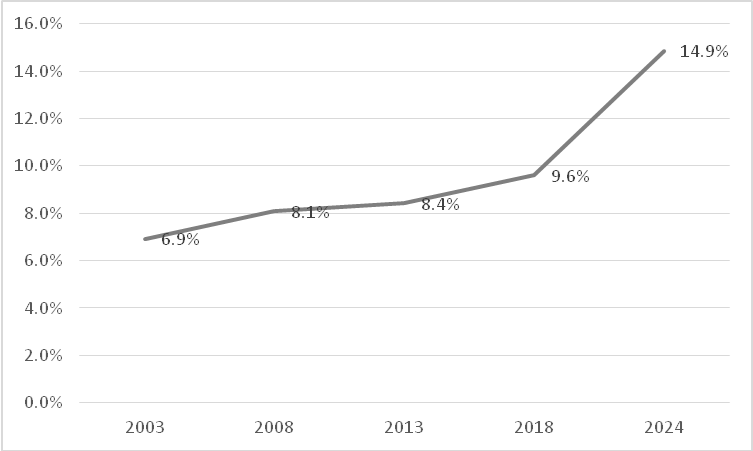
Figure 10. Percentage of Localities with Only One Candidate for Mayor, 2003–2024 (percent)
As can be seen in Figure 9, in 2024 there was a second round in 35 of 242 localities (14%), the lowest number in the last five elections. In Arab localities there was a higher rate of second rounds, but again much lower than in previous years.
From Figure 10 it can be seen that the number of localities with an unopposed candidate for mayor reached a record high in 2024—36 localities, 28 Jewish and eight Arab, up from 24 in 2018. In nine localities, more than one candidate filed originally, but dropouts left only a single candidate on Election Day.
A frequent complaint is that mayors/council heads serve many terms and it is very hard to vote them out of office. Before the last elections there were also suspicions that elections in wartime would reinforce the incumbency advantage. Figure 11 shows the status of mayors and their success at winning reelection over the years. One can also see the turnover from one year to another (that is, the number of victors in previous years who are replaced, whether because they did not run for reelection or because they lost the race).
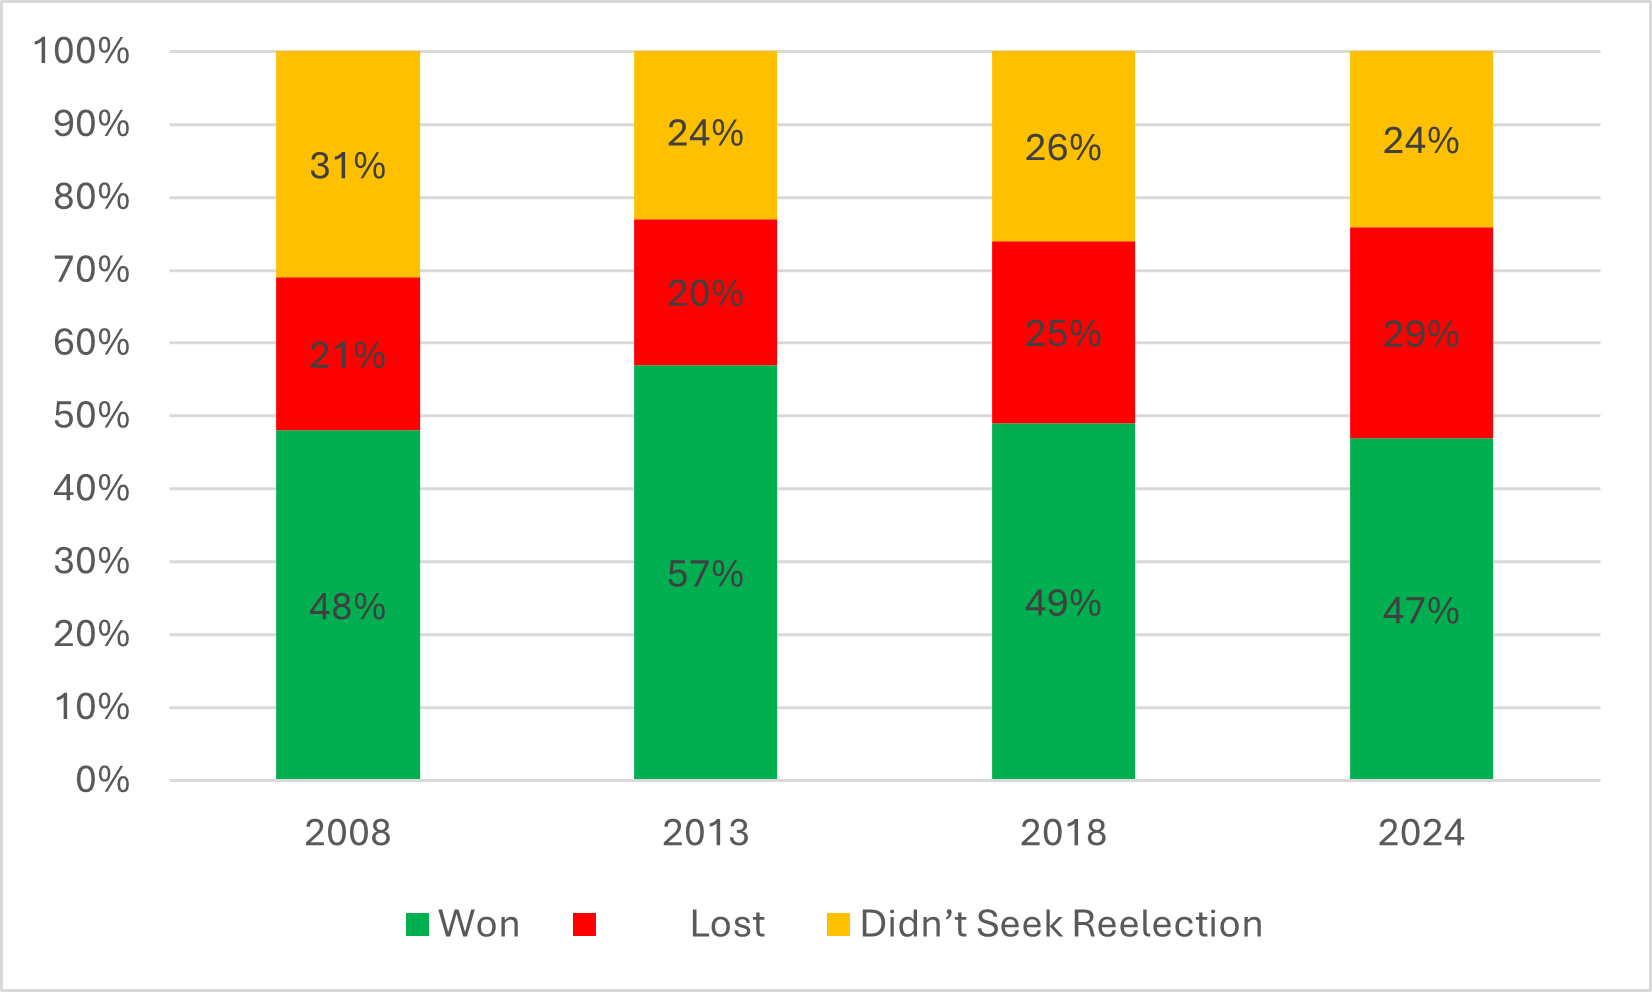
Figure 11. Mayors Standing for and Winning Reelection, 2008–2024 (percent)
It can be seen that the incumbent won reelection in 47% of the localities where elections were held in 2024: in other words, there was a turnover rate of 53%, the highest in the last four elections, although only slightly higher than the figure for 2008.
The Local Authorities (Elections) Law stipulates that a list competing for a local council can have a formal and organizational affiliation with a party represented in the Knesset (that is, a national party). The national party is considered to be the mother party and finances the local list. A local list may consist of several factions, two of them with affiliation to different national parties, or a combination of a faction affiliated with the local party and one that is not. Because affiliation with a national party is permitted in towns and local councils, but not regional councils, here we are dealing with the former only.[4] For convenience’s sake, we will refer to “affiliated lists” (linked to one or more national parties) and “independent” lists.
An affiliated list running in local elections is allowed to call itself by the name of the national party, but is not required to do so and can choose a name that does not highlight this relationship.
Figure 12 displays the relative electoral strength of affiliated lists, as expressed in the percentage of such lists and the number of seats they win; Figure 17 compares Jewish and Arab localities in this regard.
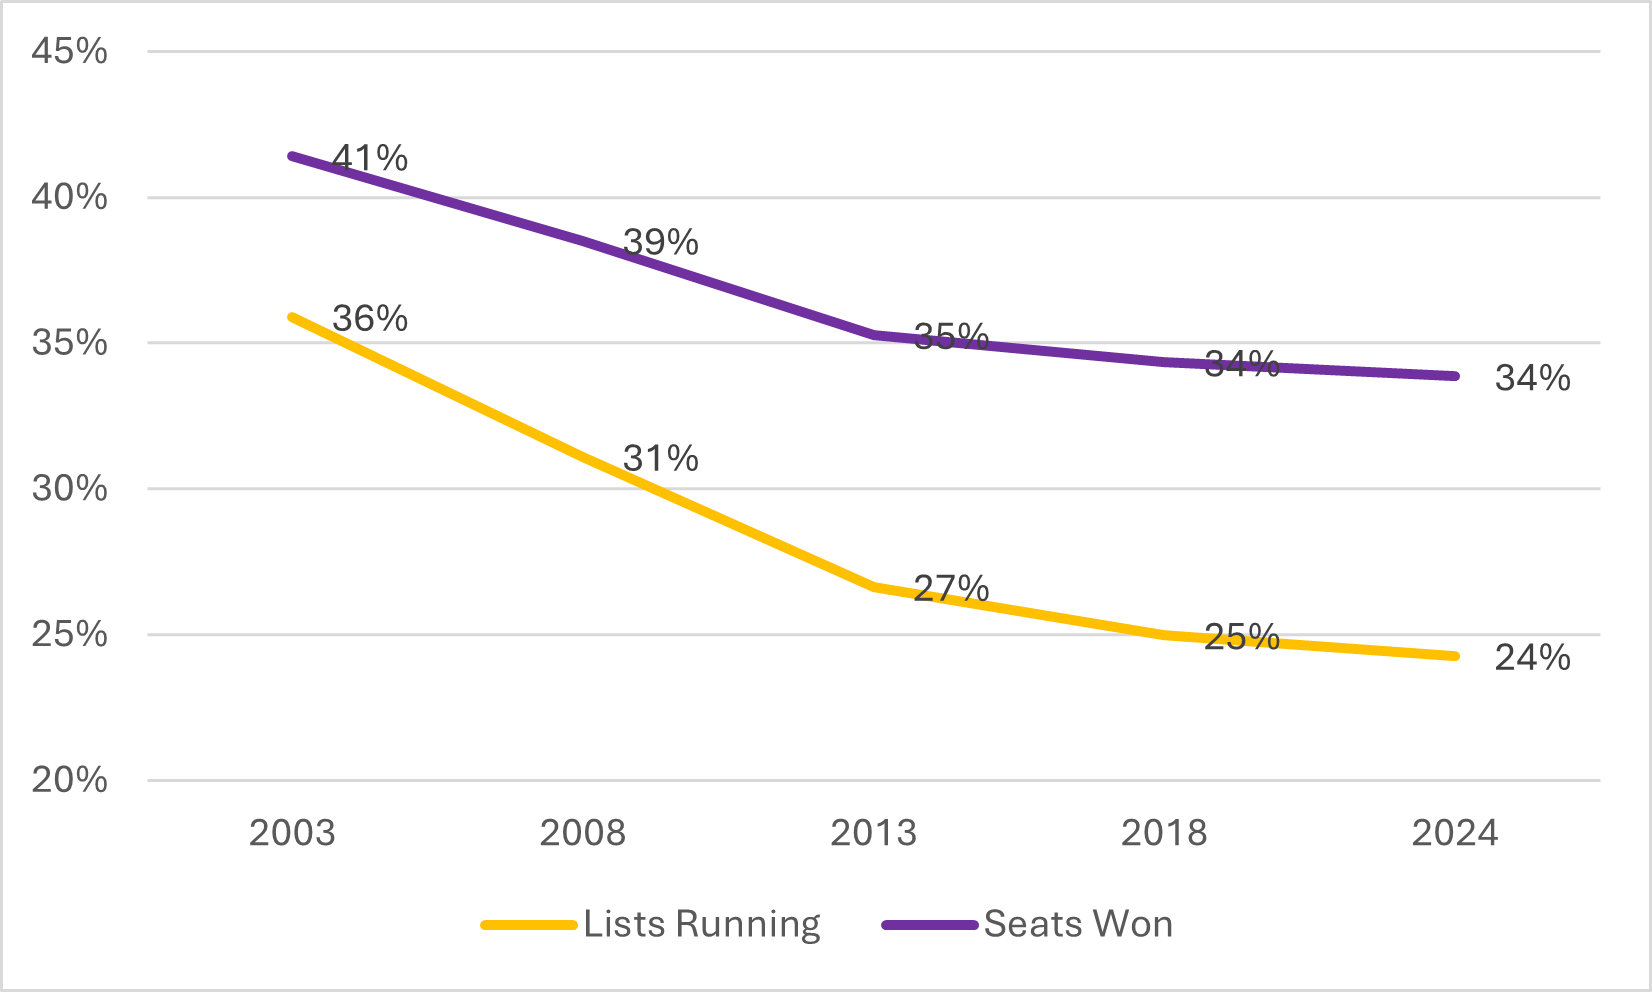
Figure 12. Relative Electoral Strength of Affiliated Lists—Percentage of All Lists Running and Total Number of Seats Won (Town and Local Councils), 2003–2024 (percent)
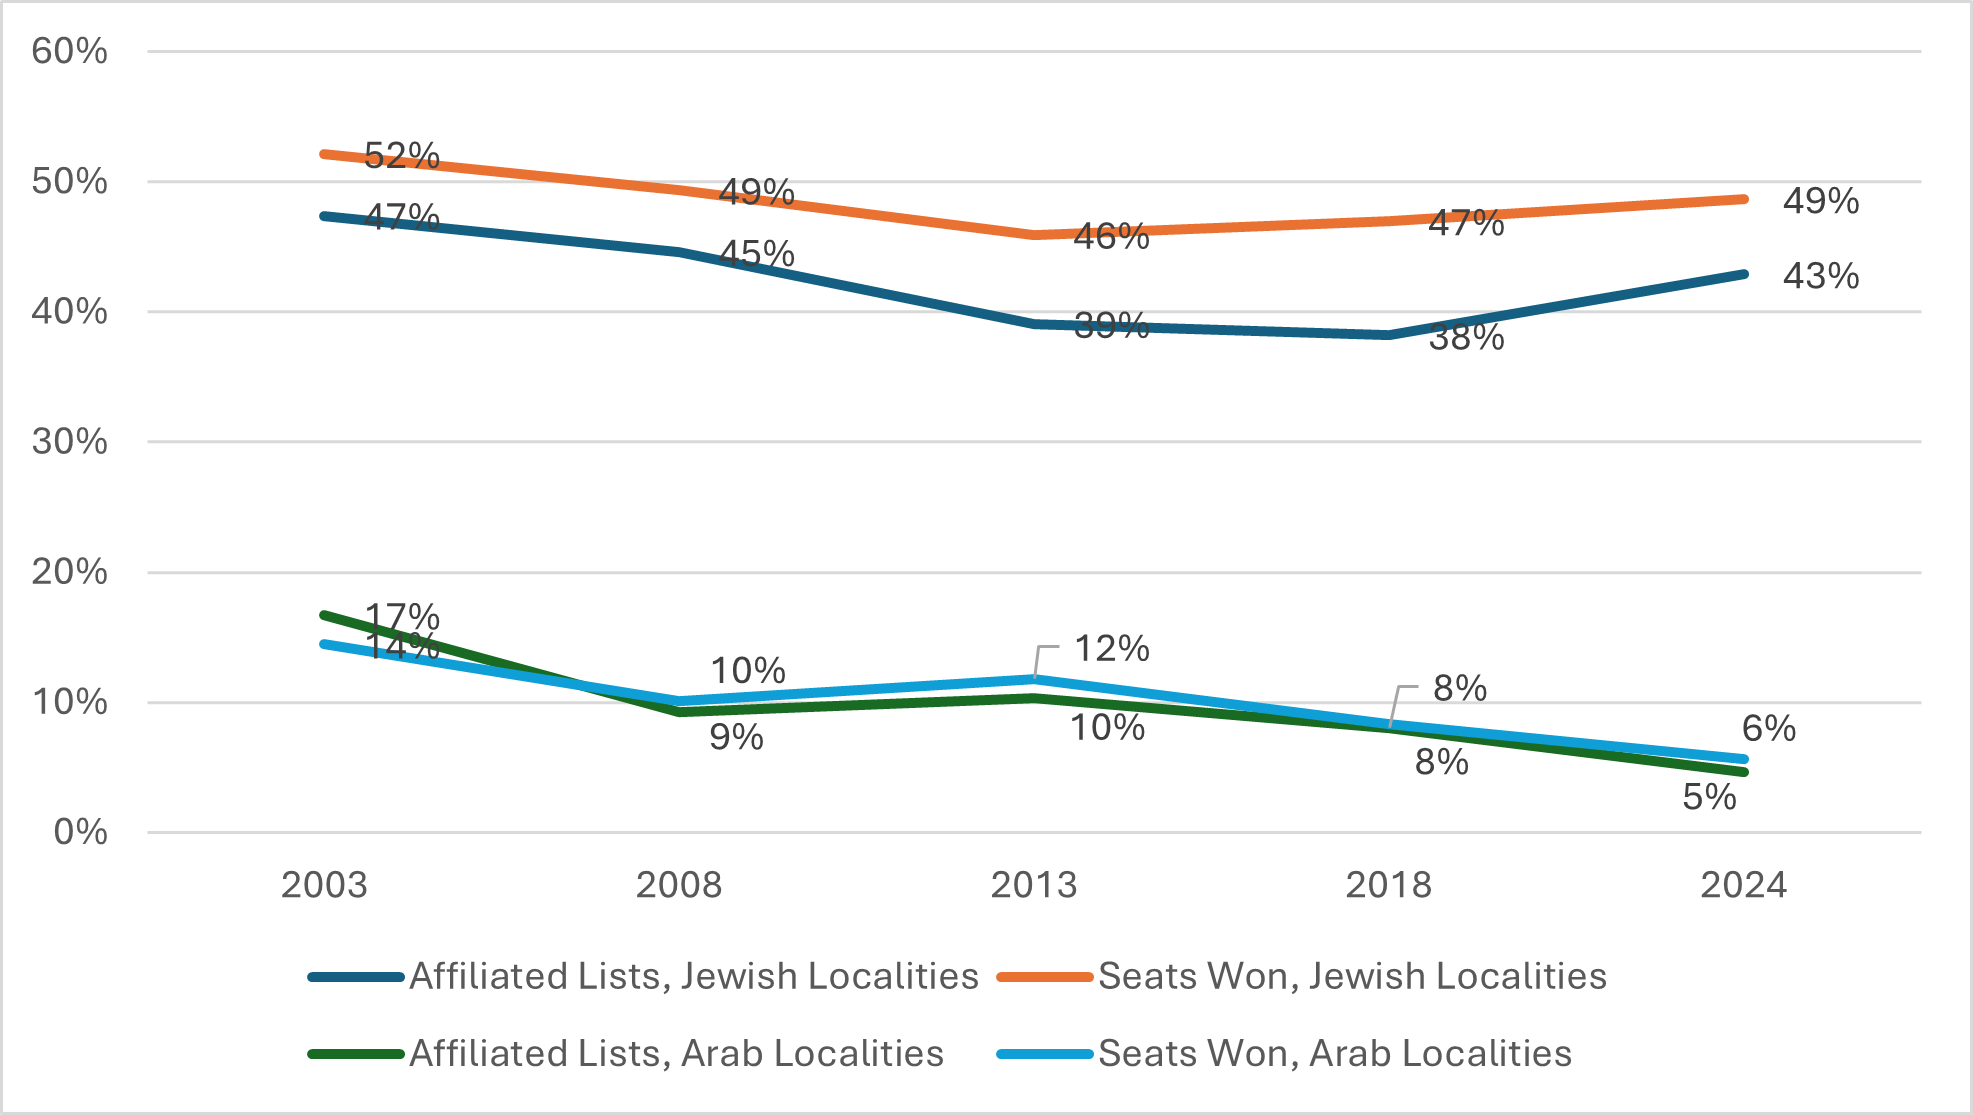
Figure 13. Relative Electoral Strength of Affiliated Lists—Percentage of All Lists Running and Total Number of Seats Won (Town and Local Councils), Jewish and Arab Localities, 2003–2024 (percent
In Figure 12 we see the declining trend in the percentage of affiliated lists over the year and a slight decrease from 2018 to 2024 (from 35% to 24%). This was not reflected in the number of seats they won, which remained the same (34%).
Figure 13 displays the trend in Jewish and Arab localities. In Arab localities the percentage of affiliated lists declined from 8% to 5% and their percentage of seats from 8% to 6%. By contrast, in Jewish localities there was actually an increase in the percentage of affiliated lists, from 38% to 43%, reflected in a slightly more moderate increase the number of seats won as well, from 47% to 49%.
[1] “Localities” means towns, local councils, and regional councils, unless otherwise stated.
[2] In practice, because the number of regional council members is disproportionate to the region’s population (because every locality in the region has at least once representative on the council), there is strong justification for considering the data for town and local councils separately.
[3] By law, an unopposed candidate for a regional council is declared the winner. In towns and local councils, if there is more than one list running (i.e., elections will be held in any case), citizens can vote for or against the unopposed candidate for mayor, who will be declared the winner only if the “for” votes outnumber those “against.” In 2024, every unopposed candidate won election.
[4] This is because regional council elections have a different format. In towns and local authorities, voters cast their ballot for a list (just as in Knesset elections). In regional councils, by contrast, the elections take place on the local level; each community chooses the number of representatives allotted it.