Statistical Report on Arab Society in Israel: 2021
Arab society in Israel is being revolutionized by the rise in the standard of living, life expectancy and education, along with the decline in fertility rates, changes to family structures, and an increasing desire to realize individual aspirations at the expense of collective values.
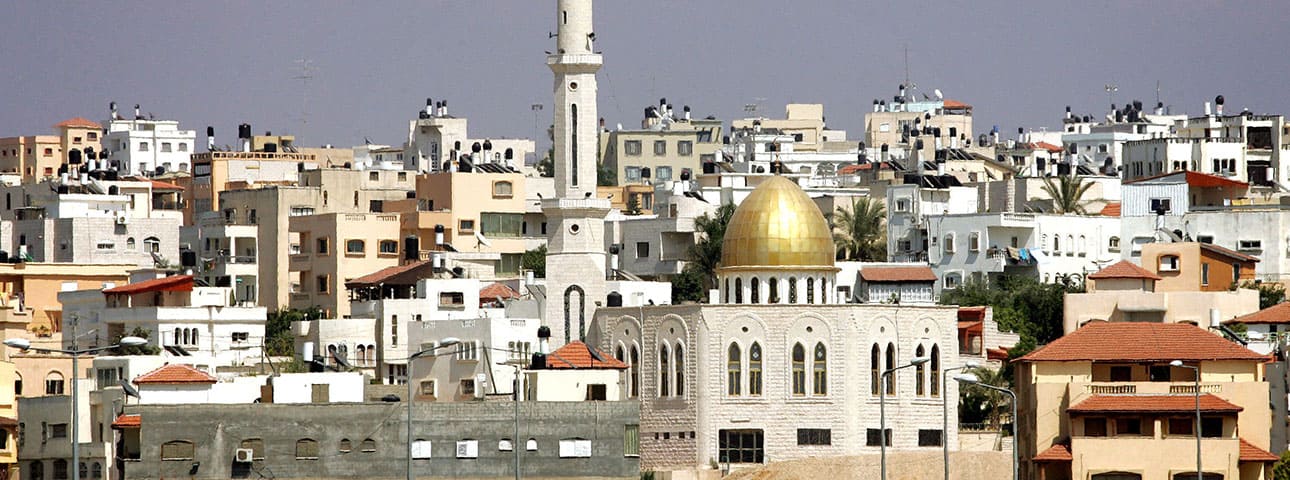
Flash 90
Population
At the end of 2020, the population of Israel stood at approximately 9,289,760, including 1,957,270 Arabs, representing 21.1% of the total. This figure includes almost 362,000 Arab residents of East Jerusalem who hold “permanent resident” status, but not full citizenship. Thus, the number of Arab citizens of Israel was 1,595,300 at the end of 2020, constituting some 17.2% of the total population.
Population of Israel by population group, (end of 2020)
| Population group | Size | % of total Israeli population |
| Jews | 6,873,910 | 74.00% |
| Arabs | 1,957,270 | 21.10% |
| Of which: Arab citizens of Israel | 1,595,300 | 17.20% |
| Others* | 458,580 | 4.90% |
| Total: | 9,289,760 | 100.00% |
* The category “others” includes non-Arab Christians and citizens with no religious affiliation.
Geographical Distribution
Israel's Arab population resides in five main areas: northern Israel, the Triangle region, the Negev, the "mixed" Arab-Jewish cities (Acre, Haifa, Jaffa, Ramle, Lod, Nof Hagalil and Maalot-Tarshicha), and the Jerusalem corridor (including West Jerusalem). Other Arab citizens live in various localities throughout the country, mainly in large cities in which the overwhelming majority of the population is Jewish.
The Arab population in northern Israel and in the mixed cities is heterogeneous in terms of its religious affiliation (comprising Muslims, Christians, and Druze), while the Arab population of the Triangle region and the Negev is homogeneously Muslim.
Arab citizens by area of residence (end of 2020 and not including East Jerusalem)
| Region | Arab population (thousands) | % Of total Arab population |
| Northern Israel | 823 | 51.60% |
| Triangle region | 314 | 19.70% |
| Negev | 280 | 17.50% |
| Mixed cities | 132 | 8.30% |
| Jerusalem corridor (including West Jerusalem) | 17 | 1.10% |
| Rest of Israel | 29.5 | 1.80% |
| Total | 1,595.30 | 100.00% |
Almost half (49.3%) of Arab citizens reside in local councils, the overwhelming majority of these, in 69 Arab local councils, and the remainder in Jewish local councils throughout Israel. Some 41% of Arab citizens live in cities, the large majority of them in 12 Arab cities and 7 mixed cities, and a smaller percentage in cities in which the majority of the population is Jewish (including West Jerusalem). Another 5.5% of Arab citizens reside in 47 small rural localities that are incorporated into regional councils. The remaining 4.2% live in localities that have no formal municipal status and are referred to as “unrecognized villages,” most of them in the Negev. In total, there are 163 localities in which all residents are Arab citizens of Israel.
Arab Citizens' locality of residence by municipal status, as of end of 2020 (not including East Jerusalem)
| Municipal status of locality | Arab citizens residing in locality (thousands) | Share of total |
| City | 654 | 41.00% |
| 493.1 (Arab cities) | 30.90% | |
| 132.2 (Mixed cities) | 8.30% | |
| 28.9 (Jewish cities, including West Jerusalem) | 1.80% | |
| Local council | 786 | 49.30% |
| 783.2 (Arab local councils) | 49.10% | |
| 2.9 (Jewish local councils) | 0.20% | |
| Locality in a regional council | 88.6 | 5.50% |
| 45.4 (Regional councils in which all localities are Arab) | 2.80% | |
| 41.6 (Mixed regional councils) | 2.60% | |
| 1.6 (Regional councils in which all localities are Jewish) | 0.10% | |
| No municipal status | 66.3 | 4.20% |
| 64.5 (Negev) | 4.00% | |
| 1.3 (Northern Israel) | 0.10% | |
| 0.5 (Triangle region) | 0.10% | |
| Total: | 1,595.30 | 100.00% |
Religious Affiliation
The large majority of Arab citizens of Israel are Muslim (82.9%), and the remainder are either Druze (9.2%) or Christian (7.9%). There are substantial differences among regions in terms of the relative size of these three religious groups. In northern Israel and the Triangle region, the Arab population is heterogeneous: The relative size of the Druze population in the north is twice as large as its national share, while the relative size of the Christian population in mixed cities is four times its national share. By contrast, the Arab population in the Triangle region and in the Negev is almost entirely Muslim.
Fertility Rates
The overall fertility rate among Arab women in Israel is 2.98 live births per woman (as of 2019), but there are significant differences among different geographic areas. The fertility rate for women in the Bedouin community in the Negev (5.26) is almost twice as high as that for Arab women in northern Israel (2.36 in the Northern District, 2.61 in the Haifa District) and in the Triangle region (2.69). There are also considerable variations in fertility rates between different religious communities in Arab society. The highest rates are found among Muslim women (3.16), followed by Druze women (2.02) and Christian women (1.76).
In the past, the overall fertility rate among Arab women in Israel was almost twice as high as that among Jewish women. Over the last two decades, this rate has fallen steadily, and the gap between Arab and Jewish women has largely disappeared. Today, the fertility rate among Jewish women (3.09) is similar to that among Muslim women. This is mainly due to a change in social patterns, including higher levels of education, the integration of Arab women into the workforce, a higher average age at first marriage (along with prolonged singlehood), and the abandonment of traditional lifestyles.
Fertility rates for women in Israel by population group, religion, and year
| Year | Jewish women | Arab women | |||
| Total | Muslims | Christians | Druze | ||
| 1995 | 3 | 418.00% | 4.69 | 2.69 | 3.5 |
| 2005 | 3 | 372.00% | 4.03 | 2.19 | 2.59 |
| 2010 | 3 | 351.00% | 3.75 | 2.17 | 2.47 |
| 2015 | 3 | 313.00% | 3.32 | 2.04 | 2.19 |
| 2019 | 3.09 | 298.00% | 3.16 | 1.76 | 2.02 |
As a result of relatively high fertility rates in the past, the Arab population in Israel is still very young. Children and youth under the age of 18 constitute 38.6% of the population, compared with 32% in Jewish society. There are differences in this regard based on religious affiliation and geographical distribution. Among Muslims, the under-18 age group make up 40.4% of the population; among Christians, 26.0%; and among Druze, 30.9%. In terms of geographical distribution, the highest percentage of children is found among Negev Bedouin, 51.8%—far higher than in northern Israel (33.8%) and the Triangle region (36.4%).
Population under the age of 17, natural population growth, and annual growth rate, by population group, religion, and geographical region, 2019
| Population group | % up to age 17 | Natural population growth (per thousand) | Annual growth rate | |
| Arabs | Total | 38.60% | 20.3 | 2.20% |
| Northern Israel | 33.80% | 14.5 | 1.40% | |
| Triangle | 36.40% | 16.6 | 1.80% | |
| Negev | 51.80% | 30.8 | 3.80% | |
| Muslims | 40.40% | 21.7 | 2.30% | |
| Christians | 26.00% | 8.8 | 1.00% | |
| Druze | 30.90% | 12.8 | 1.30% | |
| Jews | 32.00% | 14 | 1.60% | |
Infant Mortality
Over the last two decades, infant mortality rates among Arab citizens have declined steadily, yet they remain twice as high as the equivalent rates for Jews: 5.3 versus 2.2 per thousand live births, respectively, in 2019.
Within Arab society, there are considerable differences by religion. Between 2015 and 2019, the average infant mortality rate for Muslims (5.9 per thousand live births) was almost twice as high as the rates for Druze (3.9) and Christians (2.9).
Significant variations in infant mortality rates are also found among geographical regions. The average infant mortality rate in Negev Bedouin localities is twice as high as the average rate in Arab localities in northern Israel and the Triangle region.
Infant mortality rates among Arabs per thousand live births, by population group, religion, and geographical area, 2019
| Arabs—Total | 5.3 |
| Muslims | 6 |
| Christians | 1 |
| Druze | 3 |
| Northern Israel | 4 |
| Triangle region | 4 |
| Negev | 9.6 |
| Jews | 2.20 |
Life Expectancy
Life expectancy among Arabs is on the rise, due to improvements in various health indicators. Over the last two decades, life expectancy for both Arab men and women has increased by three years, similar to the equivalent increase among Jews. However, differences between Jews and Arabs remain large: Life expectancy for Arab men and or women is the same as the life expectancy for Jewish men and women 20 years ago.
Life expectancy in Israel by gender and population group, 1996–2019
| Years | Men | Women | ||
| Average life expectancy | Arabs | Jews | Arabs | Jews |
| 1996–1999 | 75 | 7670.00% | 77.2 | 8050.00% |
| 2000–2004 | 75 | 7810.00% | 78.3 | 8200.00% |
| 2005–2009 | 76 | 7960.00% | 79.3 | 8310.00% |
| 2010–2014 | 77 | 8080.00% | 81 | 8410.00% |
| 2015–2019 | 77.5 | 8140.00% | 81.7 | 8490.00% |
Socioeconomic Ranking of Arab Localities
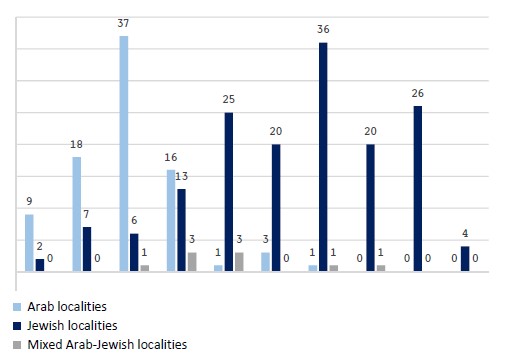
The majority of Arab localities are small to medium- sized. Most are located in Israel’s social and geographic periphery, which heavily influences their economic and social status. According to the Central Bureau of Statistics, almost all (95%) of Arab localities rank in Israel’s lowest socioeconomic clusters, and 11%- in the lowest cluster of all (cluster 1). Only 5% of Arab localities are in clusters 6–10. By contrast, only 17% of Jewish localities fall in the lower clusters 1–4, while 68% rank in clusters 6–10.
Localities in Israel by socioeconomic cluster type of locality and population group, 2017 (absolute numbers)
Poverty
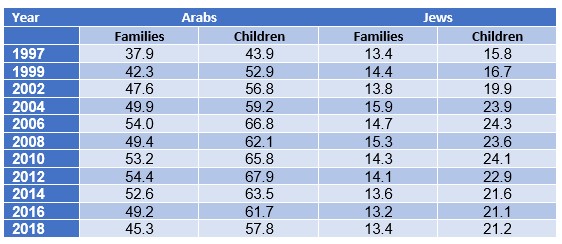
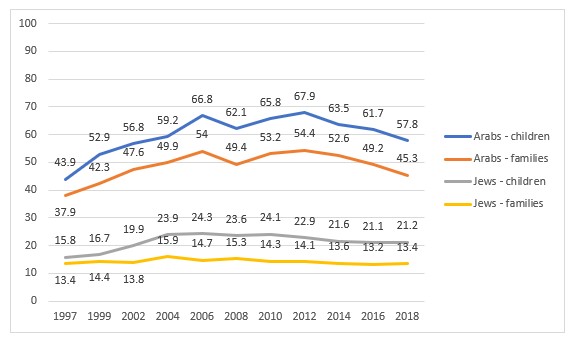
The National Insurance Institute sets the poverty line in Israel as a relative measure, and accordingly determines the percentage of families falling above or below the line. Prior to the COVID-19 pandemic (in 2018), the percentage of Arab families below the poverty line (after supplementary government payments) was 45.3%, and among Arab children-57.8%. Poverty rates among Jews were considerably lower, at 13.4% of families and 21.2% of children.
The pandemic brought with it both public health and socioeconomic challenges. Its impact on families' economic situation cannot be overlooked, particularly in Arab society. Many families have experienced financial crises, as their breadwinners found themselves out of work as a result of the pandemic, dealing a blow to their incomes and to their standard of living.
Poverty rates by population group, 1997–2018 (%)
Poverty rates
Digital Access and Internet Usage
In 2018, 60.8% of Arab citizens in Israel had access to a computer or tablet, compared with 83.8% of Jews (a gap of 23 percentage points). However, the gap between Jews and Arabs in terms of internet use is narrowing. In 2019, 81.8% of Arabs were internet users, compared with 88.1% of Jews (a gap of 7 percentage points). In recent years, internet use among Arab citizens has risen steadily, from 70.9% in 2017 to 74.2% in 2018, and 81.1% in 2019. One of the reasons for this increase is the growing use of smartphones.
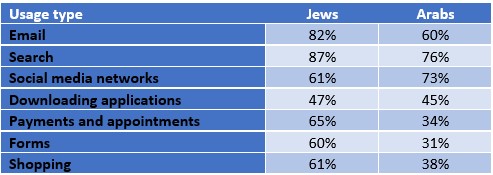
Despite this trend, data produced by the Israel Internet Association for 2017 indicates a sizable difference between Jews and Arabs in their patterns of internet usage: 82% of Jews use email services, compared with 60% of Arabs; 65% of Jews pay bills and make appointments online, comparted with 34% of Arabs; and 60% of Jews use the internet to complete online forms, versus just 31% of Arabs. On the other hand, internet use for social purposes is higher among Arabs than among Jews, with 61% of Jews using social media networks compared with 73% of Arabs.
Internet usage by population group, 2017 (%)
Housing
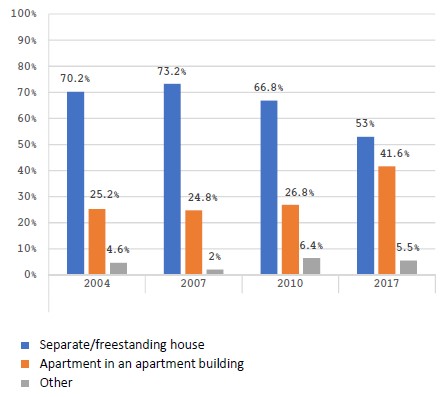
Between 2004 and 2017, there was a relatively small decline in home ownership among the Arab population, from 91.9% of families to 90.3%, and a corresponding increase in the percentage of families living in rented apartments, from 6.6% to 6.7%. In the Jewish population, the home ownership rate stood at 74% of families in 2017. Between 2004 to 2017 we can see a decline in separate/freestanding homes from 70.2% to 53% and an increase over the same period in apartments from 25.2% to 41.6%.
Types of Housing in Arab localities 2004–2017
Household Expenditures
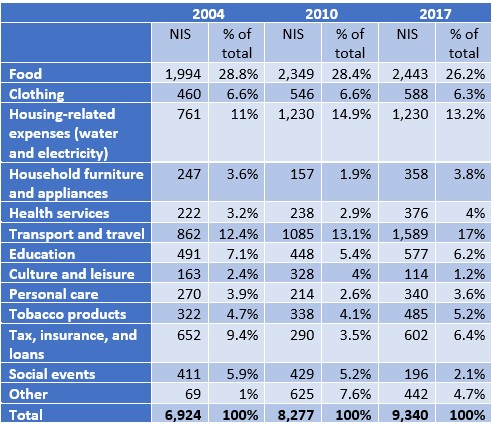
According to surveys conducted by the Galilee Society from 2004 to 2017, the average monthly expenditure for Arab families rose considerably, from NIS 6,924 in 2004 to NIS 9,340 in 2017, due to increased expenditures in almost every category of expenses. For example, housing expenditures rose from NIS 761 per month (11% of total expenditures) to NIS 1,230 (13.2%). The table below details average Arab family expenditures according to various categories of products and services. It shows noticeable increases in monthly expenditures on food, from NIS 1,994 in 2004 to NIS 2,443 in 2017, and on transport and travel, from NIS 862 in 2004 (12.4%) to NIS 1,589 in 2017 (17%).
Average monthly expenditures for Arab families, 2004–2017
Ownership of Products and Commodities
In 2004, only 36% of Arab families had air conditioning in their homes, a figure that rose to 87% in 2017. Similarly, the percentage of Arab families owning a car rose from 64% in 2004 to 83% in 2017. Meanwhile, the decline in ownership of a home telephone line—from 68% in 2004 to 20% in 2017—can be attributed to rising access to cellphones, laptops, and the internet, which have rendered fixed telephone lines largely irrelevant.
Another finding with sociocultural significance is the sharp rise in the percentage of Arab families who own a satellite dish, up from 67% in 2004 to 91% in 2017. This trend is indicative of the media consumption habits of Arabs in Israel, who are much more connected to foreign satellite television channels and media outlets, particularly those in the Arab world.
Violence and Crime
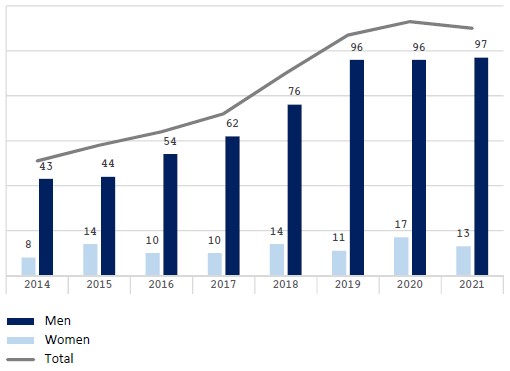
In recent years, rising violence and crime have become major concerns in Arab society, and the number of Arab citizens who have lost their lives has risen steadily. While there were 51 Arab murder victims in 2014, this figure has since risen to 94 in 2019, 113 in 2020 (96 men and 17 women), and 110 in 2021 (97 men and 13 women). Indeed, over the last decade, the number of murder victims in Arab society has almost tripled. At the same time, the number of Arab citizens wounded in shooting incidents increased more than threefold between 2016 and 2018, from 82 to 301. Since 2000, some 1,574 Arab citizens have been killed, 68 by the police (4.3%) and 1,506 by other Arab citizens.
Arab murder victims by gender, 2014–2021
Employment Rates
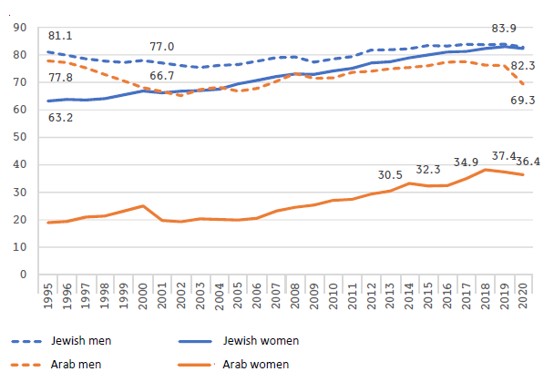
Between 1995 and 2002, employment rates among Arab men declined steadily by more than 10 percentage points. Beginning with the mid-2000s., Arab employment rates among men began to recover, against the backdrop of the recovery of the market as a whole from the dotcom crash and the Second Intifada. These rates then stagnated between 2017 and 2019, and even declined slightly. In 2020, following the outbreak of the pandemic in March, employment rates for Arab men dropped sharply to a low of 69.3%.
Similarly, employment rates for Arab women rose steadily from the mid-2000s. Between 2001 and 2018 the rate almost doubled, climbing from 19.8% to 38.2%.
Employment rates (ages 25–64), by population group and gender (%, 1995-2020)
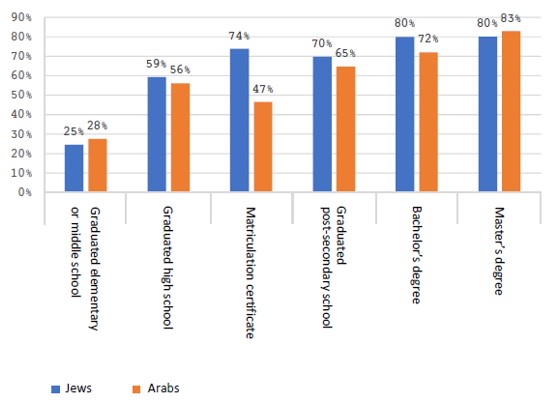
One of the main factors behind the relatively low employment rates for Arab men and women is their low level of education. 77% of the Arab population is educated only up to matriculation level or lower, and only 15% hold an academic degree. By contrast, 33% of the Jewish population have a degree. These gaps in education have implications not only for Arab citizens’ prospects of entering the workforce, but also for their potential earning power and working conditions.
At higher levels of education - undergraduate and above - the gaps between Arabs and Jews in employment rates are almost completely erased. On the other hand, in the low levels of education, the chances of Arabs entering the labor market are considerably lower compared to Jews with the same level of education.
Employment rates (aged 15+), by educational attainment and population group, 2019 (%)
Economic Sectors
Another key factor in wage gaps between Jews and Arabs is the relatively limited range of economic branches in which Arab employees are employed, mainly – those paying lower salaries on average and which do not require highly skilled labor.
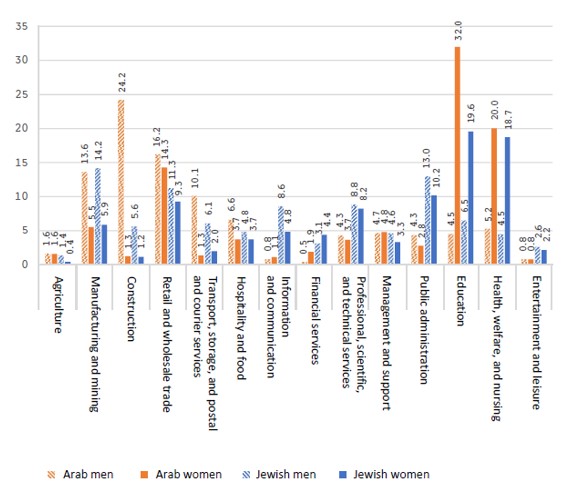
Arab men are employed mainly in construction, manufacturing, retail and wholesale trade, hospitality, and transport industries. A very small percentage (especially in comparison with Jewish men) work in the information and communication industries in financial services, in professional, scientific and technical services, and in public administration. In construction, retail and wholesale, and hospitality—economic sectors that together employ almost half of Arab men—average salaries are lower than the national average. And even in manufacturing, the information and communication sector, and professional, scientific and technical services, in which salaries are higher than the national average, Arab workers earn less.
Arab women are also concentrated in sectors that pay lower-than-average salaries. Around one-half of Arab women work in education or in health and social services, sectors in which the average wage is lower than the national average. A relatively high percentage of Arab women are employed in the retail and wholesale industries, where here too-- the average salary is relatively low. By contrast, only a negligible percentage of Arab women are employed in information and communication industries, financial services, and professional, scientific and technical services. For example, only 0.8% of Arab women are employed in the information and communication sector, compared with 4.8% of Jewish women—a rate that is six times higher.
Employees (aged 15+) in main economic sectors, by gender and population group, 2019 (percent)
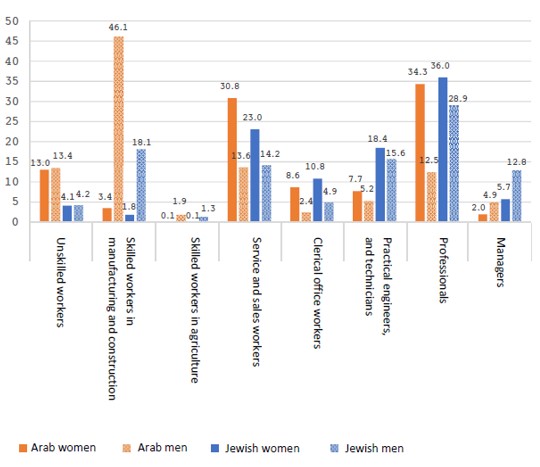
Occupations
Not only are Arab men and women employed mainly in low-income industrial sectors, they also largely work (particularly Arab men) in occupations that are unskilled, poorly paid, and have high rates of physical burnout. Almost one-half of Arab men are skilled workers in industries such as construction, manufacturing, and agriculture, compared with a much lower percentage of Jewish men (19.4%). These occupations are characterized by long working hours, high rates of physical burnout, and lower-than-average salaries. At the same time, a high percentage of Arab employees (both men and women) are unskilled workers.
Among Arab women who are employed, a high percentage are professionals, mainly in the fields of health and education. In addition, a high percentage of Arab women are employed in sales and services. Compared with Jews, a small percentage of Arab men and women are employed in technical professions and in management positions. These occupations pay higher salaries than those in which most Arab workers are employed.
Employers (aged 15+) by occupation, population group, and gender, 2019 (%)
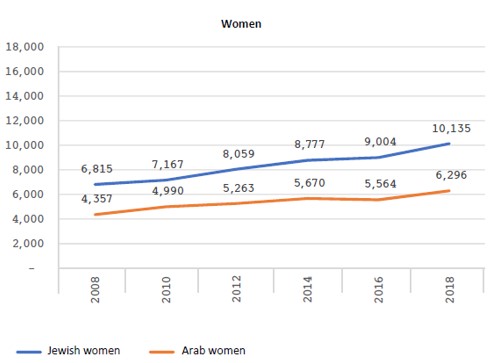
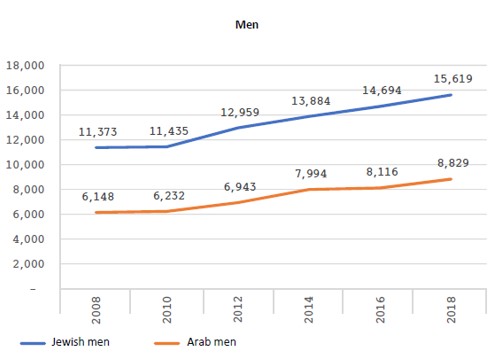
Salaries
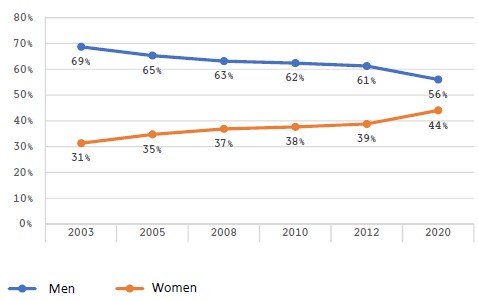
Between 2008 and 2018, average nominal salaries rose throughout the workforce. Though salaries in the Arab population rose considerably during this period, the salary increase among the Jewish population was larger, and the gaps between the two groups widened. There were some differences in this trend between men and women. The gap between Arab and Jewish women increased over this decade, from 56% to 61% in favor of Jewish women, while among men, the gap declined from 85% in 2008 to 77% in 2018, in favor of Jewish men. In any case, the salary gap is very high for both sexes, in favor of the Jewish population.
Average monthly nominal salary for salaried workers (aged 25–64), by gender and population group, 2008–2018 (NIS)
The COVID-19 pandemic further widened the gaps between Arabs and Jews (excluding ultra-Orthodox Jews). Jews are under less pressure to find a job and have more time to consider different options, to negotiate with potential employers over salary and employment conditions, or to undertake vocational or professional training that will develop their skills and give them an advantage. By contrast, the Arab population has been pushed even more into low-income jobs with harsher conditions, due to a lack of options.
School Infrastructure and Students
Ever since 1949--the first school year following the establishment of the State- there has been impressive growth in the number of students in the Arab education system, and the number of schools and classrooms. The growth in elementary education has been particularly dramatic- at a rate several times higher than the equivalent growth in the Jewish system. Yet the real revolution in the Arab education system has been in secondary education, as shown by the data in Table 11 below.
In the 2020–2021 school year, the number of Arab pupils reached 437,000 (not including kindergartens), some 24% of the total school population in Israel. And alongside the opening of kindergartens, elementary schools, middle schools, and high schools, other educational frameworks such as community centers have been established, and provide afterschool activities.
Number of schools, students, and classrooms in the Arab education system 1948–2020
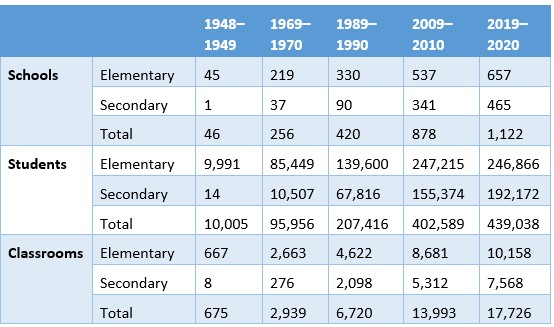
Despite the increase in the number of schools and the decrease in class size, Arab schools still suffer from the impact of many years of discrimination. The situation is particularly severe in the Negev, where there is an acute shortage of schools and classrooms in Bedouin localities, and particularly in unrecognized Bedouin villages. In all the unrecognized villages, which are home to around 70,000 residents, there are only 10 elementary schools, and not a single secondary school. The Ministry of Education has recognized the need to build more schools and classrooms in the Arab education system, but faces obstacles in attempts to do so – a lack of available land for construction in Arab localities and significant planning challenges.
Government Budgeting Per Student
In 2011, the State allocated an average of NIS 13,192 for each elementary school student in the Arab education system, compared with NIS 14,862 per elementary school student in the Jewish system (a difference of NIS 1,670). In 2018, state funding for elementary education in the Arab system was NIS 16,523 per student, compared with NIS 17,529 in the Jewish system (a difference of NIS 1,006). That is, the gap in funding for Jewish students and Arab students in elementary schools is narrowing.
With regard to middle schools, Arab students were allocated an average of NIS 15,300 per student in 2011, compared with NIS 18,495 for Jewish students, a difference of NIS 3,195. In 2018, the equivalent figures were NIS 20,578 and NIS 22,459, respectively – a difference of NIS 1,881. Thus, as a result of changes in budgeting formulas and various programs instituted by the Ministry of Education, the funding gap between Arab and Jewish students in middle school is shrinking.
The largest gap in funding between Arab and Jewish education can be found in high schools. In 2011, the difference in per-student funding stood at NIS 7,265: NIS 24,084 for Jewish students, versus NIS 16,819 for Arab students. Unlike with regard to elementary and middle schools, the funding gap in high schools has continued to grow. In 2018, Jewish students were allocated an average of NIS 34,301, compared with NIS 24,759 allocated to Arab students, a difference of NIS 9,542. This significant difference is not simply a direct result of inequitable budgeting by the Ministry of Education, but is also influenced by two other budgetary sources: local government funding and funding by parents' contributions.
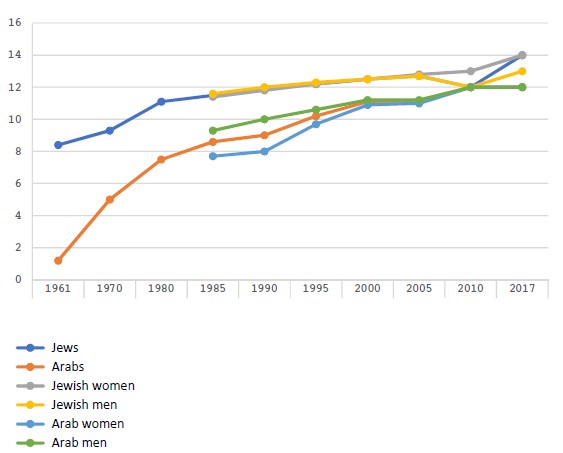
Median Number of Years of Education
The median number of years of education among Arabs has risen dramatically, from 1.2 at the beginning of the second decade of the State of Israel to 12 in 2017. Gender differences in median years of education have also decreased: In 1985, the median was 7.7 years for Arab women and 9.3 for Arab men; in 2017, the median for both sexes was 12 years. Despite these improvements, there is still a gap between Arabs and Jews, though it has dropped from 7.2 years in 1961 (8.4 for Jews and 1.2 for Arabs) to 2 years in 2017 (14 for Jews and 12 for Arabs).
Median number of years of education for ages 15+, by population group, and selected years (absolute numbers)
School Dropout
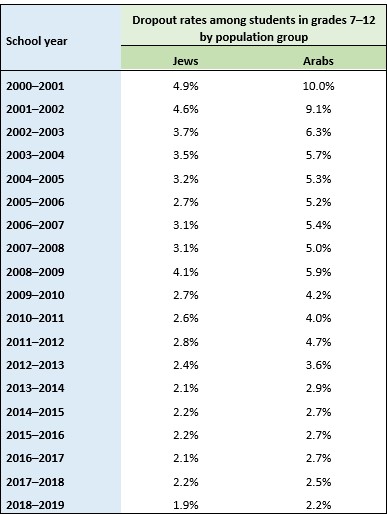
School dropout is one of the more serious challenges facing the education system as a whole, and particularly among Arabs. In the 2000–2001 school year, the dropout rate among Arabs stood at 10%, compared with 4.9% among Jews; and in 2018–2019, 2.2% as compared with 1.9% among Jews.
School dropout rates among students in grades 7–12, by population group, 2000–2019 (%)
School Dropout
School dropout is one of the more serious challenges facing the education system as a whole, and particularly among Arabs. In the 2000–2001 school year, the dropout rate among Arabs stood at 10%, compared with 4.9% among Jews; and in 2018–2019, 2.2% as compared with 1.9% among Jews.
School dropout rates among students in grades 7–12, by population group, 2000–2019 (%)
Matriculation
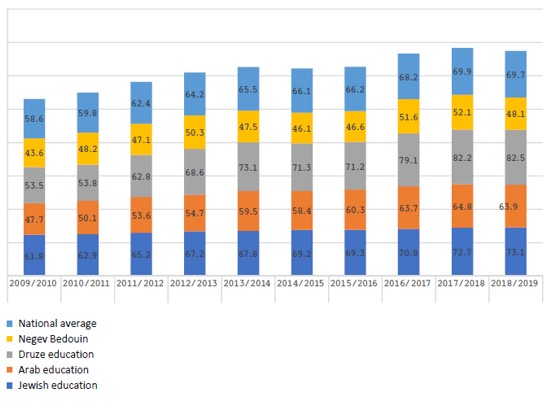
The matriculation rate in the Arab school system has risen dramatically over the last decade, from 47.7% in 2009–2010 to 63.9% in 2018–2019. However, this still falls well below the equivalent rate in the Jewish education system, in which rates increased from 61.8% to 73.1% over the same period.
Within the Arab school system, there are very noticeable variations. Matriculation rates in the Druze system are even higher than in the Jewish school system, having risen from 53.5% in 2009–2010 to 82.5% in 2018–2019. By contrast, Bedouin education in the Negev lags far behind, with only a modest increase, from 43.6% in 2009–2010 to 48.1% in 2018–2019.
Matriculation rates among 12th-grade students, by education system, 2010–2020
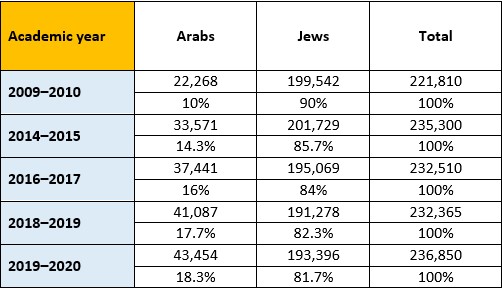
Students in Higher Education
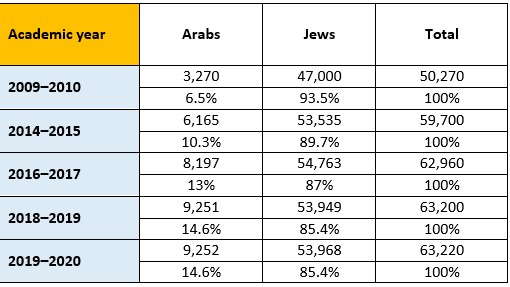
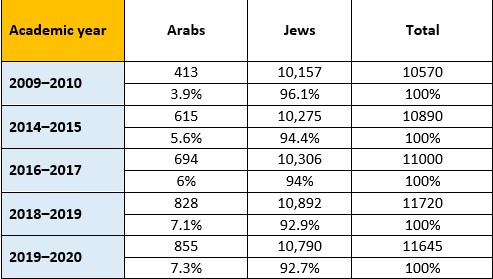
The percentage of Arab undergraduates studying in Israeli academic institutions rose from 10% (22,268) in the 2009–2010 academic year, to 18.3% (43,454) in 2019–2020. That is, the total number of Arab undergraduate students and their share of the total undergraduate student population has almost doubled over the last decade. This trend is even more significant among students for an MA degree, among whom the relative size of the Arab population has almost tripled, from 6.5% of all master’s students (3,270) in 2009–2010 to 14.6% (9,252) in 2019–2020. The proportion of Arab Ph.D. students has seen a smaller increase over this period, from 3.9% (413) in 2009–2010 to 7.3% (855) in 2019–2020.
Undergraduate students in Israeli institutions of higher education, by population group, 2010–2020 (in absolute numbers and %)
Master’s degree students in Israeli institutions of higher education, by population group, 2010–2020 (in absolute numbers and %)
Doctoral (Ph.D.) students in Israeli institutions of higher education, by population group, 2010–2020 (in absolute numbers and %)
There is a gap between the percentage of Arab students enrolled in higher education institutions and the percentage graduating from those institutions: In any given year, the percentage of students is higher than the percentage of graduates. There are two main reasons for this finding. First, Arab students tend to take longer to complete their studies towards a degree-that is, longer than the standard period of study defined by the institutions. Second, many Arab students choose study tracks that do not necessarily reflect their true interests, and subsequently switch to an alternative track, thus extending the period required to complete a degree.
The percentage of Arab citizens gaining a bachelor’s degree has risen from 10.3% in 2007 to 13.6% in 2019. For master’s degrees, the increase has been even steeper, from 4.9% in 2007 to 12.4% in 2019, while for doctoral degrees, there has been a rise from 2.8% in 2007 to 6% in 2019.
Arabs Employed in the Civil Service
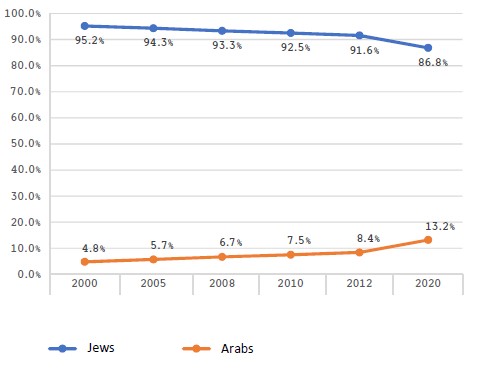
In 2000, Arab employees constituted 4.8% of civil service employees. A decade later, in 2010, this figure had risen to 7.5%, and by 2020 it reached 13.2%. While this represents a significant improvement in Arab representation in the civil service, it still falls below the relative share of Arabs among the general population.
Civil service employees by population group, 2000–2020 (%)
In 2003, 876 Arab women were employed in the civil service, constituting 31% of all Arab civil service employees. A decade later, in 2012, their number had more than doubled to 2,140 women, that is-39% of all Arab civil service employees (an increase of 8 percentage points). This trend continued to 2020, by which time there were 4,773 Arab women out of a total of 10,848 Arab employees in the civil service, some 44%. The rise in the percentage of Arab women gaining an academic education in recent years has led to more Arab women applying for civil service jobs, and to a narrowing of gaps between Arab men and Arab women.
Arab civil service employees by gender, 2003–2020 (%)
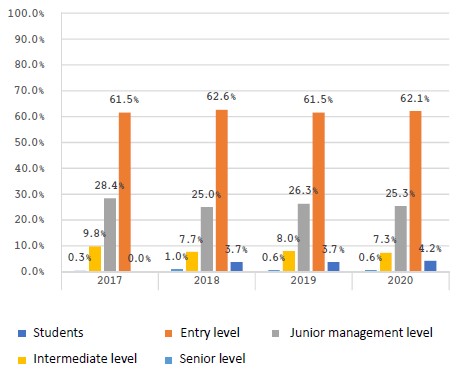
There are currently four levels of civil service ranks: entry, junior management, intermediate, and senior. While there has been a marked increase in Arab representation in the civil service, this has not been translated into Arab employees holding senior positions. These positions have a decisive influence on the design and implementation of public policy, particularly policy relating to the Arab public in Israel. Between 2017 and 2020, the percentage of senior positions held by Arabs did not exceed 1%: In 2017- 0.3%, and at the end of 2020- 0.6%. The lion’s share of Arab employees are employed in entry-level positions (62.1%), and only 25.3% hold junior management roles. Thus, it is important to distinguish between representation in numbers, and senior-level positions.
Arab employees in the civil service by rank, 2017–2020 (%)
Arab workers are employed mostly in three government ministries: the Ministries of the Interior, Education, and Health. Arab representation in the Ministry of Education workforce rose from 6.1% in 2005 to 8.8% in 2020. In 2020, 19.3% of Ministry of the Interior employees were Arabs, and the Ministry of Health has seen a marked improvement in Arab representation, from 7% in 2005 to 19.5% in 2020.
Arabs Employed in Government Companies
The percentage of Arab board members in government companies has risen dramatically from 1.2% in 2000 to 12% in 2018. Board members exert direct influence over policy and on issues relating to the representation of Arabs in their companies. Despite the improvement in Arab representation on company boards, Arabs are still under-represented in the companies’ employees. Between 2013 and 2019 the proportion of Arab employees in government companies rose from 2.2% to 2.58%—a tiny increase- and one which leaves the percentage of Arab workers in government companies far below the relative share of Arabs in the general population.
Arab Voter Turnout in Knesset Elections
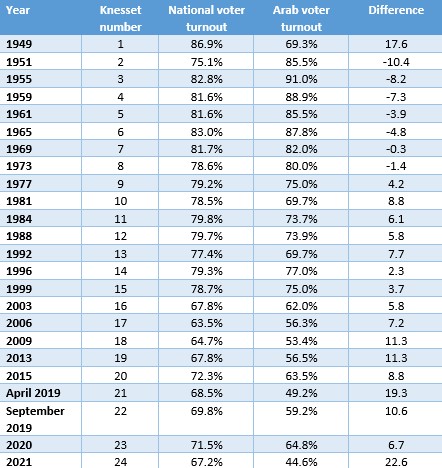
Voter turnout among Arab citizens of Israel tends to fluctuate significantly, and has seen multiple peaks and slumps between the first Knesset elections in 1949 and the elections for the 24th Knesset in 2021. In general, voter turnout among Jews has been higher than among Arabs, with the exception of the early decades of the state. The history of Arab voter turnout can be categorized according to four main periods:
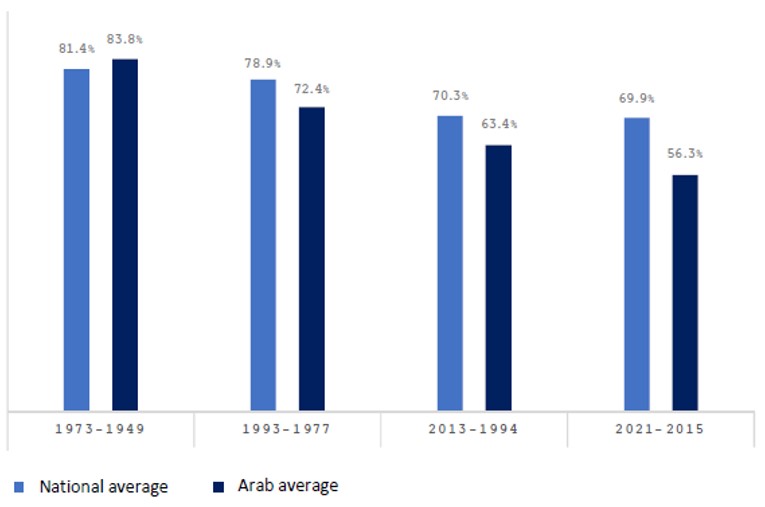
The first period (1949–1973, from the founding of the state to the 1973 Yom Kippur War) was marked by the military administration imposed on the Arab population, against the backdrop of what were the tragic consequences of the 1948 war for Arab society. The average voter turnout in the Arab public during this period (83.8%) was higher than the national average (81.4%).
The second period (1977–1993, from the Land Day and the founding of the Hadash party through to the signing of the Oslo Accords) was rife with political events that increased political engagement and drove the establishment of numerous political frameworks, both parliamentary and non-parliamentary. At the same time, this period also saw the emergence of groups calling to boycott elections for political and ideological reasons. Average voter turnout in the Arab public during this period stood at 72.4%, compared with a national average of 78.9%.
During the third period (1996–2013, from the first Netanyahu government to the third Netanyahu government), relations between Jews and Arabs in Israel reached a new low. Radical political groups gained more influence in the Arab public discourse and casted doubt as to the effectiveness of political participation in the Knesset. Voter turnout continued to decline during this period, reaching an average of 63.4% in the Arab public, compared with 70.3% nationally.
The fourth period (2015–2021) begins with the establishment of the Joint List in 2015 and ends with its dissolution, and the inclusion of Ra’am in the government formed after the elections for the 24th Knesset. Average voter turnout during this period was just 56.3% among Arabs, compared with a national average of 69.9%. The period saw a noticeable decline in voter turnout in the Jewish public as well, but there remained a sizable gap between Jewish and Arab voter turnout which was reflected in the balance of power in the Knesset and the government.
Voter turnout in Knesset elections, 1949–2021
Average voter turnout by population group, 1949–2021
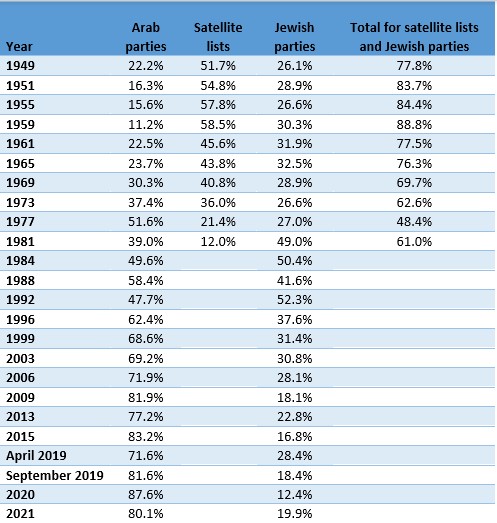
Arab votes by political party, 1949–2021 (% of total Arab votes)