Who Doesn’t Vote in the Israeli Knesset Elections?
What has contributed to the decline in voter turnout in Israel? This article explores possible causes and presents a profile of the non-voters in the 2013 Knesset elections. The findings that it reports raise concerns about the value of equality in political participation in Israel.
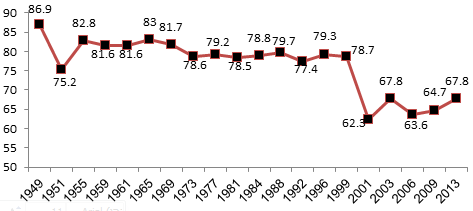
Voter turnout is one of the measures of public involvement in political life and is considered to be an important indicator of confidence in the political system. In Israel, since the start of this century, we have witnessed a decline in voter turnout (Figure 1). Although this trend is typical of many countries (Hermann et al., 2013: 168–171), it is interesting to study its parameters in the Israeli context.
This article reviews studies that have investigated possible factors for the decline in voter turnout in Israel and then presents a profile of the "non-voters" in the 2013 Knesset elections. This research reveals disturbing findings about the value of equality as expressed in political participation in Israel.
Figure 1: Voter Turnout in Israel, 1949–2013
The Correlation between Socio-Economic Status and Voter Turnout
A study of voter turnout in Knesset elections from 1996 through 2006, broken down by the socio-economic clusters of localities defined by the Central Bureau of Statistics, found that voter turnout is greater in the clusters that have higher levels of income and education, in ultra-Orthodox communities, and in communities with an older population (i.e., fewer residents aged 20–29). An analysis of the data for the 2013 elections shows a continuation of this trend (see Table 1; Afriat and Dahan, 2010). This finding is especially worrisome in light of the growing socio-economic disparities in Israel.
Table 1: Socio-Economic Status and Voter Turnout in Knesset Elections (Selected Years)
| 1996 | 1999 | 2003 | 2006 | 2009 | 2013 | No. of localities (2013) | ||
| All localities, Jewish and non-Jewish | 81.2 | 80.2 | 68.5 | 61.3 | 60.2 | 63.2 | 188 | |
| Clusters 1–2Because Cluster 1 includes only one ultra-Orthodox locality, for the purpose of comparing all local authorities and non-ultra-Orthodox Jewish communities, the lowest clusters were presented twice (Clusters 1–2 and Clusters 2–4). | 78.7 | 77.8 | 65.2 | 59.8 | 53.7 | 56.7 | 49 | |
| Clusters 2–4 | 78.9 | 77.8 | 66.0 | 59.5 | 55.7 | 58.5 | 95 | |
| Clusters 8–10 | 86.3 | 86.4 | 76.6 | 70.1 | 71.6 | 74.5 | 30 | |
| Non-ultra-Orthodox Jewish localities | 83.5 | 82.7 | 71.6 | 63.0 | 64.4 | 67.2 | 107 | |
| Clusters 1–2 | - | 74.7 | 56.4 | 44.4 | 44.9 | 51.6 | 1 | |
| Clusters 2–4 | 81.8 | 80.1 | 68.2 | 58.7 | 57.2 | 60.7 | 22 | |
| Clusters 8–10 | 86.3 | 86.4 | 76.6 | 70.1 | 71.6 | 74.5 | 30 |
Source: Afriat and Dahan 2010 (Hebrew), updated with data for the 2013 elections
The Correlation between Place of Residence and Voter Turnout
An IDI study that analyzed the decline in voter turnout in Israel in the 2009 elections as compared to the 1999 elections and broke the findings down by locality found that eight of the 12 towns with the largest drop in turnout were located in the geographic periphery and ranked low on the socio-economic scale (Kiryat Shemona, Tiberias, Dimona, Beit She’an, Safed, Afula, Yeroham, and Hatzor Hagelilit), while another three were towns that had a poor economic standing even though they are located in the center of the country (Ramle, Kiryat Ekron, and Bat Yam). In contrast, the most moderate drops in voter turnout were found in places with a religious character (Elad, Modi’in Illit, Elkana, and Bnei Brak) and in upper-class towns, whether in the center of the country (Har Adar, Savyon, Kokhav Yair) or in the periphery (Omer and Kiryat Tivon). In an analysis of voter turnout in 2009, researchers found an inverse correlation between the proportion of immigrants in the population (defined as those who arrived in Israel from 1990 on) and voter turnout rates; that is, the larger the share of recent immigrants in the town, the lower the turnout. They also found a direct correlation between level of education and income in the locale and voter turnout; that is, turnout was higher in places where the residents have more education and higher income (Atmor and Friedberg, in press).
Personal Variables that Affect Voter Turnout
In an IDI study that examined the profiles of people who report that they do or do not intend to vote (in the 2009 elections, within the Jewish sector), the percentage of people who planned to vote was higher among adults older than 30, among people with college/university degrees, and among people who are totally alienated from Jewish tradition (Philippov, in Atmor and Friedberg, in press).
Concern about the decline in voter turnout has been a feature of the Israeli political scene for more than a decade. This concern has been exacerbated in the period before the 2015 elections, because the elections are taking place so soon after the previous elections, in the shadow of corruption scandals, and alongside a decline in public confidence in political institutions. In order to reach a better understanding of the phenomenon of nonvoting, in the lines that follow, we present an analysis of survey findings from before and after the 2013 elections.The survey was conducted by Prof. Michal Shamir during the last months before the election in 2013 among a representative sample of 1,718 eligible voters. A second survey, conducted about a week after the elections, polled 1,292 of those interviewed in the first survey. See www.ines.tau.ac.il. An analysis of the findings make it possible to examine the answers to two questions more closely: Who are the nonvoters? And do people who say they will stay home on Election Day in fact refrain from voting?
Findings
The following question was asked in a pre-election survey in 2013: “Today some people do not vote, for one reason or another. Do you intend to vote in the Knesset elections?” The distribution of the answers is shown in Figure 2.
Figure 2: Intentions to Vote in the Elections for the 19th Knesset (Percent)
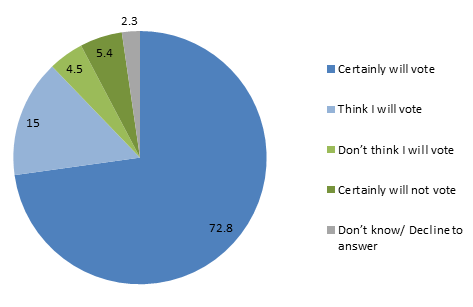
As the graph shows, about three-quarters of the respondents (72.8%) were certain that they would go to the polls, while another 15% thought they probably would do so. Only 10% were certain they would not vote or were inclined not to do so (about 2% did not answer).
In the repeat survey, conducted about a week after the 2013 elections, approximately 92% of respondents reported that they had in fact voted, slightly more than those who had declared their intention to vote before the elections. What is astonishing is that this figure is much higher than the actual turnout (67.8%). There are several possible explanations for this discrepancy. One is the disparity between the number of people listed on the voter rolls and the number people who actually have the potential to vote. As stated, many people who are listed on the voter rolls are living abroad; thus, in practice, the turnout among citizens who can actually go to the polls on Election Day exceeds the figure calculated on the basis of all eligible voters. In advance of the 2013 elections, for example, the Central Bureau of Statistics estimated that there were 5.1 million eligible voters living in Israel—half a million less than the number of eligible voters listed in the voter registry (CBS 2012). So it is possible to say that the “true” turnout for the 2013 elections was actually higher than the official figure (about 75%).
Other explanations of this finding are linked to the possible influences of the survey itself. For example, there may be self-selection by people who agree to take part in pre-election surveys, as it is plausible that there is an over-representation of respondents with strong political involvement. Social pressure may also affect responses, as people who did not vote may be uncomfortable saying that they failed to perform a basic civic duty. Another possibility is that the first survey increased respondents’ awareness of the importance of voting and inspired individuals who thought that they would not vote to reconsider and go to the polls.
Did People Who Said They Didn't Intend to Vote Follow Through?
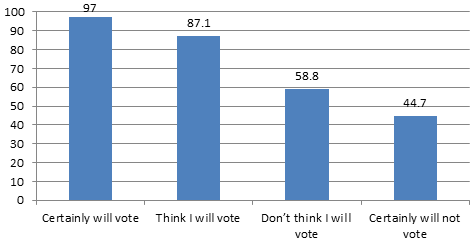
An interesting phenomenon revealed by a comparison of the before and after polls concerns respondents who changed their mind at the last moment; that is, people who said that they were not planning to vote but did go to the polls on Election Day. The survey reveals that about half of those who said that they were not planning to vote did vote in the end. By contrast, the overwhelming majority of respondents who said that they were planning to vote kept their word and did so (Figure 3).
Democracy Institute, p. 50, Table 3.2 (Hebrew).
Figure 3: Voting on Election Day by Declared Intention before the Elections (Percent)
An analysis of the characteristics of respondents who said they were not planning to vote and of respondents who reported that they did not vote yields several conclusions about the profile of the non-voters (Table2): Table 2 depicts the profile of the 10% of respondents who said before the elections that they were certain or thought that they would not exercise their right to vote (171 respondents), and of the 8% who reported after the fact that they had not voted (100 respondents).
- Arabs: A higher percentage of Arabs than Jews said that they were not planning to vote and in fact did not vote. Approximately 26% of Arab respondents said that they would not vote and 18% reported after the fact that they had not voted, as compared to 7% in each category among Jewish respondents.
- Young Adults: The largest percentage (17.7%) of those who said that they would not go to the polls was found in the youngest age cohort (18–22), i.e., those eligible to vote for the first time. This was also the age group with the highest percentage (about 15%) of respondents who reported after the elections that they did not vote in the 2013 elections; for every other age cohort, those who did not plan to vote and/or did not vote ranged between 7% and 9%.
- The Poor: The highest proportion of non-voters was found among respondents who placed themselves in the lowest socio-economic class, as compared to those who ranked themselves in better-off strata. About 17% said they would not vote, as opposed to between 8% and 12% of respondents in the higher classes; about 16% reported that they did not vote, in contrast to 6%–7% in the other classes.
- New Immigrants: The percentage of non-voters who immigrated to Israel from the former Soviet Union since 1989 was greater than that the percentage among native-born Israelis and longer-settled immigrants. About 12% of new immigrants said that they would not vote and about 16% reported after the fact that they had not voted, as against 6% in each of these categories among long-settled Jews and native-born Jews.
- The Less Educated: The percentage of respondents with no more than a high-school education and without a matriculation certificate who said that they were not planning to vote and in fact did not vote was greater than the comparable figure among respondents with more education. About 11% of those with less education reported that they had not voted, as compared to 6%–8% of the more-educated who did not go to the polls.
Smaller differences in the rate of non-voters as compared to other groups were found in the following categories:
- Gender: Women were more likely than men—12% versus 8%—to say that they would not vote. Actual voter turnout of both genders, however, was similar: 9% of women and 7% of men reported that they did not vote.
- Ethnic Origins: About 7% of Mizrahim (Sephardim) born abroad said that they would not vote, and after the elections, 9.5 % said that they had not voted. Among their Israeli born offspring, the figures were 8% and 6%, respectively. By contrast, only 5% of respondents born in Europe-America said that they would not vote and the same number reported that they had not voted. Among their Israeli-born offspring, the figures were 5% and 3%, respectively. Among second-generation Israeli-born respondents, 6% said that they would not vote and 4.5 % reported that they had not voted.
- Religious Observance: Secular and traditional Jews are less likely to vote than the religious and ultra-Orthodox. About 8% of the secular and traditional Jews said that they would not vote, and about 7% to 8% reported afterwards that they had not voted. By contrast, only 2% to 3% of the religious and ultra-Orthodox said that they would not vote, and after the elections, 5% of the religious and only 1% of the ultra-Orthodox reported that they had not gone to the polls.
- Political leanings: Jews who identified themselves as in the political center were more apt to say that they would not vote (about 8%) than those who identified themselves as right-wing (6%) or left-wing (4%). After the elections, the left-wing respondents reported greater participation in the elections (only 3% did not vote) than respondents in the other camps: 8% of those who said they were centrists and 7% of those on the right reported that they had not gone to the polls.
The low rate of abstention found among those who identify with the left may be linked to the socio-demographic profile of this camp, since surveys indicate that left-wing voters have more education and a higher socio-economic status than voters who vote for the right.Those who identify themselves as on the left also showed the lowest percentage of those who feel that they are poor (13.4%), whereas the highest percentage of the self-identified poor is found among those who see themselves as right-wing (20.6%). See Hermann et al., 2014a: 31 (Hebrew). Some 45.1% of those on the left have a college or university education, as compared to 35.9% of those in the center and 33.3% of those on the right. See also Shamir (above, n. 2). As indicated above, people who match this profile have higher voting rates. Another explanation for the left’s greater turnout rates is the fact that over the last decade the left has been a political minority,Only 15.1% of Jews placed themselves on the political and security left, as against 46.8% on the right and 26.8% in the center. Another 11.3% did not respond [see Hermann et al., 2014a: 250 (Hebrew)]. fighting for representation in the Israeli political system, which is going through a period of transition with regard to elites and ideologies (Hermann et al., 2014b). In other words, this camp realizes its electoral potential more than others.
Table 2: Analysis of Non-voters in the 2013 Elections, by Socio-Economic and Demographic Variables (Percent)
| Before the Elections: "Don't think I will vote" and "Certain I won’t vote" |
After the Elections: "I didn’t vote" |
|
Gender |
||
| Men | 8.3 | 6.8 |
| Women | 11.6 | 8.7 |
| Age | ||
| 18–22 | 17.7 | 14.9 |
| 23–49There are almost no differences between age sub-groups that are narrower than ages 23–49. | 9.3 | 7.2 |
| 50–69 | 9.4 | 6.9 |
| 70+ | 8.8 | 9.3 |
| Nationality | ||
| Jews and others | 7.1 | 6.8 |
| Arabs | 26.1 | 18.1 |
| Years in the Country (Jews) | ||
| Immigrants from the FSU, 1989–2012 | 12.1 | 15.7 |
| Long-settled Jews and native-born Jews | 6.2 | 5.5 |
| Continent of Origin (Jews) | ||
| Born in Asia-Africa | 7.2 | 9.5 |
| Born in Europe-America | 4.5 | 4.7 |
| Born in the USSR/FSU | 10.9 | 15.3 |
| Born in Israel, father born in Israel | 5.8 | 4.5 |
| Born in Israel, father born in Asia-Africa | 7.8 | 6.2 |
| Born in Israel, father born in Europe-America | 5.0 | 3.0 |
| Born in Israel, father born in USSR/FSU | 8.6 | 10.0 |
| Education | ||
| Up to high school, no matriculation certificate | 13.2 | 10.8 |
| Full secondary with matriculation certificate | 12.0 | 7.9 |
| Post-secondary or college/university but no degree | 7.0 | 7.3 |
| College/university, bachelor’s degree or higher | 8.4 | 6.4 |
| Self-Ranking on the Socio-Economic Scale | ||
| Upper class | 11.8 | 6.7 |
| Upper middle class | 10.4 | 5.6 |
| Middle class | 8.4 | 7.1 |
| Lower class | 16.7 | 16.0 |
| Political Identification (Jews) | ||
| Left or Left-leaning |
4.1 | 3.4 |
| Center | 8.3 | 8.0 |
| Right or Right-leaning | 5.8 | 6.8 |
| Self-Defined Religiosity (Jews) | ||
| Secular | 8.1 | 7.2 |
| Traditional | 8.4 | 8.2 |
| Religious | 2.2 | 4.6 |
| Ultra-Orthodox | 3.3 | 1.4 |
An analysis of the profile of non-voters presented in this study coupled with an analysis of turnout by socio-economic and geographic variables in other studies indicates that the tendency not to vote is related to a sense of social marginality (Arabs and immigrants from the former Soviet Union, and people in the lower socio-economic classes or with less education) or to a lack of political experience and interest (young adults). Because this trend has existed for a decade and was shown to have existed in 2013 as well, we may assume that it will be reflected in the 2015 elections, too. This is a cause for concern, because it demonstrates an inequality in political participation and indicates that these groups are excluded from the political discourse. The low participation rate among Arabs, immigrants from the former Soviet Union, and voters in the lower socio-economic class evidently reflects the skepticism among these populations that their voices will be heard in the political system and attests to their greater estrangement from the democratic political game.Variables of the political climate that explain stronger voting trends for the Knesset in 2009 include the respondents’ feeling that they are part of the State of Israel and its problems, their confidence in the party that they voted for in the previous elections, a feeling of being able to influence government policy, and an interest in politics; see Philippov (in press).
Nevertheless, there are unique factors in the 2015 elections that could affect voter turnout in general and in specific groups in particular. For example, the fact that the last elections were held only two years ago may produce antagonism and cause a decline in voter turnout.
Alternatively, the close race between the two major blocs could actually encourage people from all walks of Israeli society to go to the polls. In addition, it is likely that certain groups may be influenced by various political developments. For example, the merger of the Arab parties into a single list is likely to affect participation patterns in this sector, the corruption scandals associated with Yisrael Beytenu—which is seen as a party of immigrants—may affect the turnout of its voters, the split in Shas could impact turnout among Mizrahim, and so on.
Will all citizens of Israel, whatever their socio-economic status, place of residence, or nationality, turn out to vote on March 17, 2015? If so, these elections will be the very best expression of Israel’s choice of a democracy in which the elected institutions represent all strata of the population and reflect their preferences.
- Atmor, Nir, and Chen Friedberg (in press). “Voter Participation in Knesset Elections: Center vs. Periphery,” in: Nir Atmor and Chen Friedberg (eds.), Voter Turnout in Israeli General Elections. Jerusalem: Israel Democracy Institute. Graphs 2.4, 2.6, 2.7 (Hebrew).
- Afriat, Avishai, and Momi Dahan, 2010. “Correlation between Socio-economic Status and Voting for the Knesset,” Ha-riv’on le-kalkalah (March) (Hebrew).
- Hermann, Tamar, et al., 2013. Israel Democracy Index 2013. Jerusalem: Israel Democracy Institute (Hebrew and English).
- Hermann, Tamar, et al., 2014a. Israel Democracy Index 2014. Jerusalem: Israel Democracy Institute (Hebrew and English).
- Hermann, Tamar, et al., 2014b. The National Religious Sector in Israel 2014. Jerusalem: Israel Democracy Institute (Hebrew and English).
- Central Bureau of Statistics, 2012. “5.1 Million Eligible Voters Living in Israel Today,” Press release. Jerusalem: Central Bureau of Statistics, Dec. 26, 2012. (Hebrew)
- Philippov, Michael (in press). “Barriers to Voting and the Profile of the Passive Citizen, in: Nir Atmor and Chen Friedberg (eds.), Voter Turnout in Israeli General Elections. Jerusalem: Israel